Datadog bills each host for infrastructure, bills it again for APM, and meters logs, custom metrics and every add-on product on its own. Teams look elsewhere when that bill grows faster than their traffic, when they move to OpenTelemetry and no longer need the Datadog Agent, or when the data has to stay on their own servers. These are the eight tools worth comparing, and when Datadog is still the right call.
Maple, the first entry below: a trace on its waterfall view.
We build Maple and list it first because this is our site: that placement is our bias, not a ranking. The rest are grouped by the reason people leave Datadog: the self-hostable tools first, then hosted platforms that price differently. Every price comes from the vendor's own pricing page, linked at the bottom with the month we checked it.
How we compared: we re-read each vendor's pricing page in November 2026. Other facts repeat sourced rows from our side-by-side comparison pages, each with the month it was last checked. ClickStack and OpenObserve have no comparison page, so their facts link to their own pages below. We did not benchmark the tools against each other; treat this as a map of trade-offs, not a test result.
Updated
The short answer
Small or mid-size team moving to OpenTelemetry
Maple. One per-GB plan with no host or seat fee, covering traces, logs, metrics, uptime checks, on-call and session replay; browser sessions are the one extra meter.
Must self-host, and needs alerting and dashboards there
SigNoz or Grafana. Both have mature self-hosted installs with Helm. Maple self-hosts too, but without alerting or dashboards yet.
Already reads Prometheus metrics in Grafana
Grafana Cloud. PromQL dashboards and recording rules carry over unchanged.
Wants a hosted platform of the same breadth
New Relic. APM, browser, mobile and scripted synthetics, billed per GB and per user instead of per host.
Debugging requests you cannot reproduce
Honeycomb. BubbleUp compares the slow or failing requests against the rest, attribute by attribute.
At a glance
Tool
Pick it if
Pricing
License
Self-host
Datadog (for reference)
The tool you are replacing
Per host: infrastructure from $15, APM from $31; logs $0.10/GB plus $1.70 per million indexed events
You want uptime, on-call with phone and SMS, logs and traces on one bill.
Bundles from $30/mo; logs and traces $0.10/GB + $0.05/GB-month stored (EU)
Closed source; SaaS, custom VPC on Enterprise
No (custom VPC on Enterprise)
Maple
Built by us
Pick it if: You are moving to OpenTelemetry and want a per-GB bill with no host or seat fee.
Maple ingests OpenTelemetry directly, so the OpenTelemetry Collector and SDKs take the place of the Datadog Agent and tracing libraries. It bills on data volume only: a hundred containers on one host cost the same as one process on a hundred hosts, at equal volume. Traces, logs, metrics, errors grouped into issues, uptime checks, on-call schedules, SLOs and session replay share one plan. Browser sessions are the only other meter, with 5,000 a month included and $0.002 each after that.
Strengths
+No per-host or per-seat fee; browser sessions are the one extra meter
+Source on GitHub; self-hosts as one container
+Session replay linked to the backend trace behind each click
+A hosted MCP server, and investigations that write up what broke when an alert fires
Trade-offs
-No Network Performance Monitoring, Cloud SIEM or CI Visibility
-Uptime checks are HTTP, TCP and DNS; no scripted browser tests
-An OpenTelemetry-first catalog, not 800 vendor-maintained integrations
-SOC 2 and ISO 27001 certification still in progress
Pick it if: You want to self-host APM, logs, metrics and alerts under an MIT core.
SigNoz is an OpenTelemetry-native platform with APM, logs, metrics, dashboards and alerts. Its self-hosted Community edition is multi-user with roles, and its cloud has no user-based pricing and no host count. Metrics are billed per sample, so many small series do not turn into a custom-metrics line.
Strengths
+No user-based pricing on SigNoz Cloud
+Multi-user with roles in the free, self-hosted Community edition
+Metric samples billed at $0.10 per million; Prometheus rules carry over
Trade-offs
-15 days for logs and traces by default; longer retention raises the rate
-SAML, OIDC and fine-grained RBAC sit under the commercial license
-Exceptions are grouped by service, type and message, with no owner or state on a group
$49/mo including $49 of usage, then $0.30 per GB of logs and traces · MIT core, SSO and RBAC under a commercial license
Pick it if: Your metrics are already Prometheus, and you want logs and traces next to them.
Grafana Cloud replaces per-host billing with per-GB rates for logs and traces and a per-series rate for metrics. Teams that already scrape Prometheus keep their dashboards and recording rules as they are. Grafana IRM adds on-call schedules and escalation chains. The open-source stack self-hosts with mature Helm charts, as four services with their own scaling.
Strengths
+PromQL, LogQL and TraceQL, with dashboards-as-code
+Hundreds of plugins, and data sources such as Postgres and CloudWatch in one panel
+On-call with escalation chains in Grafana IRM
Trade-offs
-$6.50 per thousand active metric series: high-cardinality metrics stay expensive
-$8 per active user beyond the three included
-A query language per signal, and four services to run when self-hosted
Free tier, then $19/mo + $8 per user beyond three, $0.55 per GB of logs and traces · AGPL-3.0 (Grafana, Loki, Tempo, Mimir); Cloud is proprietary
Pick it if: You run ClickHouse already, or want an MIT-licensed stack to search logs and traces.
ClickStack is ClickHouse's observability stack: a UI, a preconfigured OpenTelemetry Collector and ClickHouse itself. It searches logs, traces, metrics and session replays in one place, with Lucene-style filters for search and SQL for deeper questions. The UI can also connect to a ClickHouse you already run.
Strengths
+MIT license; each component scales on its own
+Full-text search plus SQL over the same data
+Session replay alongside logs and traces
Trade-offs
-No PromQL in its documentation; metrics are queried with SQL or the builder
-At volume you operate ClickHouse yourself, or move to ClickHouse Cloud
Free to self-host; managed on ClickHouse Cloud · Open source (MIT)
Pick it if: You want to self-host one platform for logs, metrics and traces, free up to 50 GB a day.
OpenObserve covers logs, metrics, traces, RUM, session replay and error tracking, queried with SQL and PromQL. The open-source edition is AGPL-3.0, and the self-hosted Enterprise edition is free up to 50 GB of ingestion a day. Its cloud has unlimited users with no per-seat charge, and keeps metrics for 15 months and logs and traces for 30 days.
Strengths
+Self-hosted Enterprise edition free up to 50 GB a day
+Unlimited users on every cloud plan
+SQL and PromQL; metrics kept 15 months on Cloud
Trade-offs
-Queries on Cloud are billed per GB scanned
-Above 50 GB a day, the self-hosted Enterprise edition is priced by sales
Cloud $0.50 per GB ingested (annual), plus $0.01 per GB queried · AGPL-3.0 open-source edition; Enterprise edition free to self-host up to 50 GB a day
Pick it if: You want a hosted platform as broad as Datadog, and few people need full access.
New Relic is the closest like-for-like move: APM, browser and mobile monitoring, scripted synthetics and vulnerability management in one hosted platform. It drops the per-host meter for 100 GB of free ingest and $0.40 per GB after that. The bill moves to users instead: full-platform users are $99 each on Standard, capped at five, and $349 on Pro.
Strengths
+No per-host fee, and 100 GB of ingest free every month
+Scripted browser and API checks included in the platform
+NRQL, one SQL-like language across every data type
Trade-offs
-Per-user fees grow with the team
-Eight days of trace retention by default
-Some features need New Relic's agents
100 GB free, then $0.40 per GB, plus per-user fees · No (the agents are open source); SaaS only
Pick it if: Your hardest incidents are slow or failing requests you cannot reproduce.
Honeycomb is a query engine for wide events. BubbleUp ranks every attribute of a slow or failing slice of requests against the baseline. It bills per event with no host count and unlimited seats, and keeps 60 days of events and metrics on every plan.
Strengths
+BubbleUp outlier analysis, heatmaps and SLOs with burn-rate alerts
+A free plan with 20M events a month
+Unlimited seats, and 60 days of retention on every plan
Trade-offs
-Closed source; single-tenant hosting only on Enterprise
-Frontend observability is an Enterprise add-on
-No PromQL
Free up to 20M events/mo; Pro $3.00 per million events, from $150 · No (Refinery is Apache 2.0)
Pick it if: You want uptime, on-call with phone and SMS, logs and traces on one bill.
Better Stack is an incident platform with telemetry attached: uptime checks, on-call schedules and incident channels, fed by logs, traces, errors and replays. It ingests OTLP, takes PromQL, and its per-GB rate for logs and traces is among the lowest here. Its error tracking accepts the Sentry SDKs.
Strengths
+Low log and trace rates, with storage billed separately
+Uptime, Playwright checks, and on-call with phone and SMS
+Error tracking with 100,000 exceptions a month free
Trade-offs
-Closed source, with no self-hosting
-Anyone on call needs a $34/mo Responder license
-Metrics billed on stored size, from $0.50 per GB-month
Bundles from $30/mo; logs and traces $0.10/GB + $0.05/GB-month stored (EU) · Closed source; SaaS, custom VPC on Enterprise
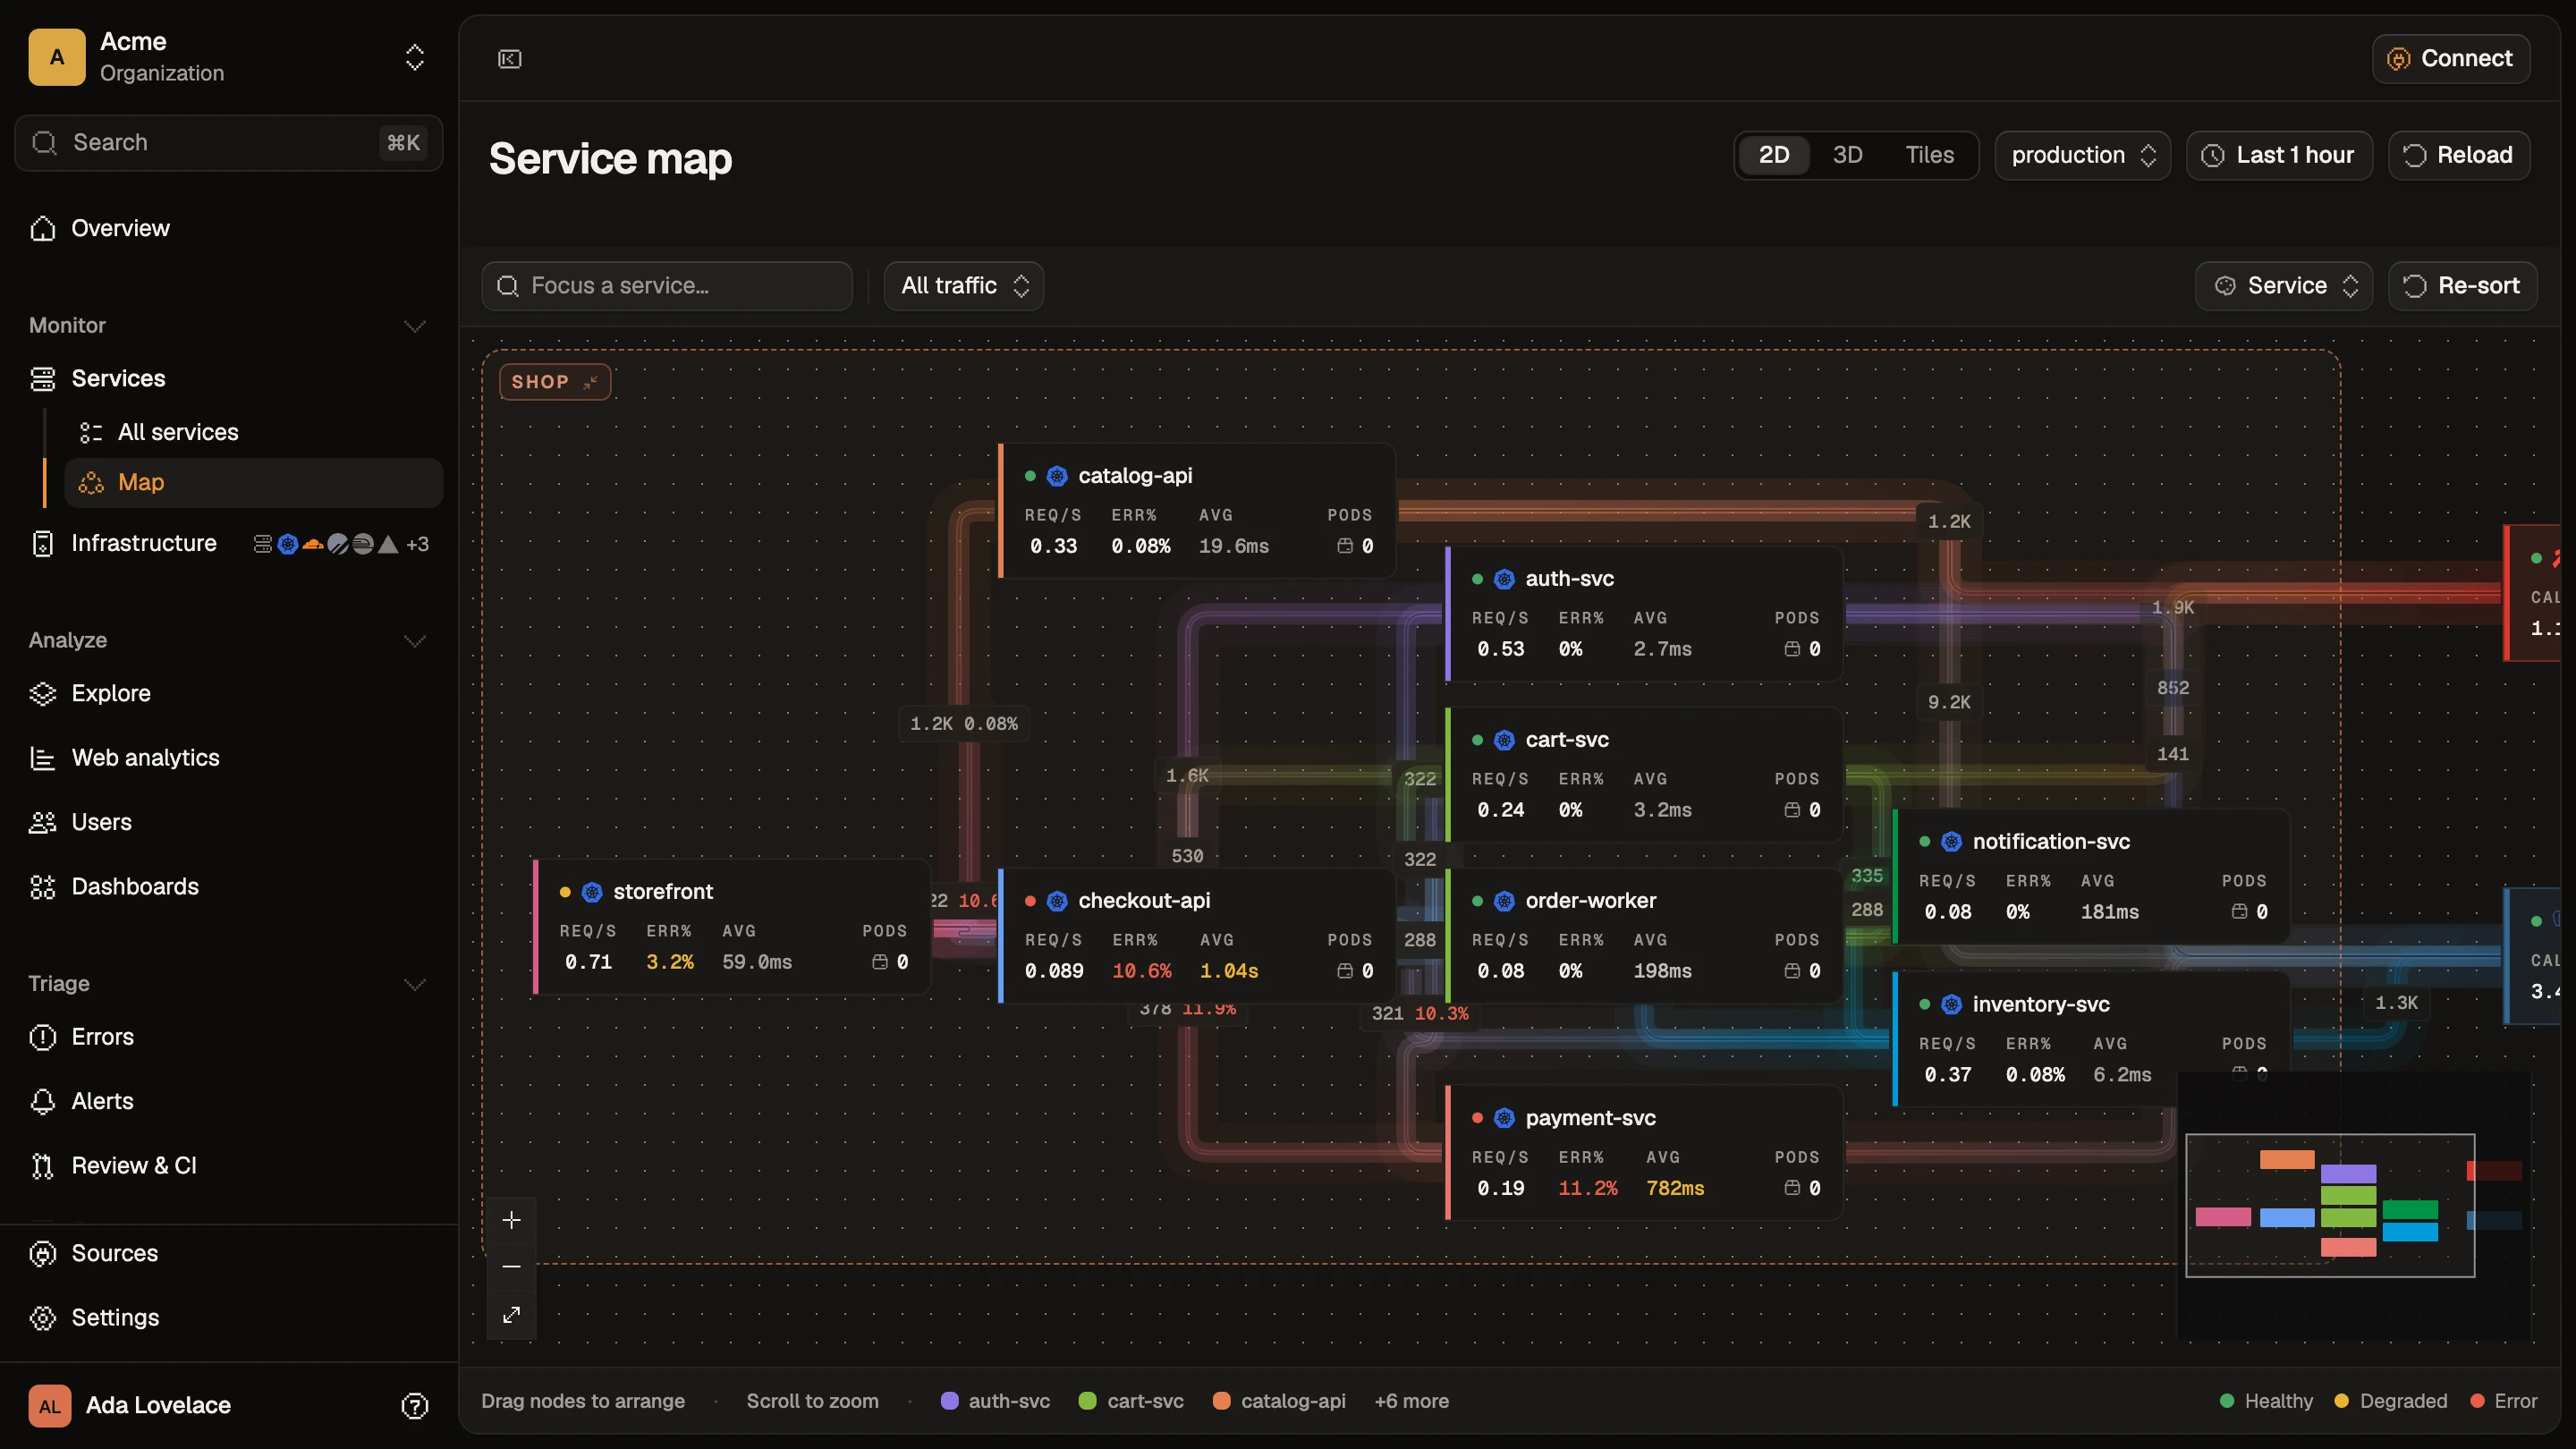
8 services · 8 edges · 60s windowpricing-svc · p99 +18% vs 1h ago
Before you switch
When to stay on Datadog
You use Datadog's security or network products: Cloud SIEM, Cloud Security, Network Performance Monitoring or CI Visibility. None of the tools here replaces all of them.
Much of what you monitor never emits OpenTelemetry. Datadog maintains more than 800 integrations, many for systems that only its Agent can read.
You need HIPAA or FedRAMP. Datadog holds both, with SOC 2 and ISO 27001.
You rely on full RUM with funnels and heatmaps, mobile RUM for iOS and Android, or browser tests from managed locations.
You run a small number of large hosts that send a lot of data. Per-host pricing is kindest to that shape, and the switch may not save much.
FAQ
Common questions
What is the best Datadog alternative?
It depends on why you are leaving. If the bill is the reason and you are on OpenTelemetry, look at the per-GB tools: Maple, SigNoz, Grafana Cloud or Better Stack. If the data must stay on your servers, SigNoz, the Grafana stack, ClickStack and OpenObserve all self-host; Maple self-hosts too, without alerting, dashboards or PromQL yet. If you want the same breadth in a hosted platform, New Relic. We build Maple, so weigh our view accordingly.
Why does a Datadog bill grow so fast?
Because several meters stack on the same host. Infrastructure is $15 per host and APM another $31 per host on annual billing. Logs are charged twice: $0.10 per GB ingested, then $1.70 per million events indexed at 15-day retention. Infrastructure Pro includes 100 custom metrics per host, and more are billed on their own line. RUM, synthetics and each security product add their own meters.
Is there an open-source alternative to Datadog?
Yes. SigNoz has an MIT core with SSO and RBAC under a commercial license. Grafana, Loki, Tempo and Mimir are AGPL-3.0. ClickStack is MIT. OpenObserve's open-source edition is AGPL-3.0. Maple is source-available under FSL-1.1 and becomes Apache 2.0 two years after each release. Datadog open-sources its Agent, not the platform.
How do I move off Datadog without downtime?
Run both for a while. Services on OpenTelemetry SDKs only need a second exporter in the Collector. Where the Datadog Agent is the only source, the OpenTelemetry Collector has receivers for host metrics, Kubernetes and file logs. Code on Datadog's tracing libraries moves to OpenTelemetry SDKs, which cover the same languages. Dashboards and monitors do not cross vendors, so rebuild the ones you use.
Is a Datadog alternative cheaper?
Usually, when you run many small hosts or containers, because per-GB pricing ignores the host count. Not always, when you run a few large hosts that send a lot of data, because per-host pricing is kindest to that shape. The Maple vs Datadog page prices one month on both at list price and has a calculator for your own numbers.
Sources
Where the vendor facts come from
Prices link to each vendor's own pricing page, with the month we last checked it. Every other claim
repeats a row on the matching Maple vs page, where it carries its own source, or comes from a vendor
page listed here. If something is out of date, tell us and we will fix it.