Maple
$74 per month
| Startup plan 100 GB per signal included | $39 |
|---|---|
| Overage 116 GB over × $0.30 | $35 |
| Team seats No per-seat fees | Free |
| Total | $74 |
Grafana is the dashboard most engineers already know, and behind it sits a stack: Loki for logs, Tempo for traces, Mimir or Prometheus for metrics, each with its own query language. Maple is a source-available observability platform that stores all three signals in one place behind one query surface.
Surfaces
Grafana is a front end over Loki, Tempo and Mimir, each with its own query language. Maple keeps every signal in one store, keyed by the same trace id, with these views already built.
Every span kept with its attributes and timing, so you see exactly what made a request slow. Click a span for the SQL it ran and the status it returned.
On Grafana: Tempo, deployed, scaled and upgraded on its own, and queried in TraceQL.
See the surface →Structured lines, linked to the trace that wrote them and kept in the same store as your traces and metrics. Any result opens the request behind it.
On Grafana: Loki, a second backend with its own query language, LogQL.
See the surface →One binary with an embedded ClickHouse. `maple start` runs the platform locally with no containers and no account, and self-hosting is one container on your own infrastructure.
On Grafana: self-hosting is mature, with Helm charts, but it means operating four services: Grafana, Loki, Tempo and Mimir.
See the surface →Differences
The marker beside each row shows which tool is ahead on it. Rows where both do the same thing are grouped into one line at the end.
| Topic | Maple | Grafana | Edge |
|---|---|---|---|
| Where they differ | |||
| Backends to run | One system. Traces, logs and metrics land in one store, keyed by the same trace id. | Loki, Tempo and Mimir or Prometheus, each deployed, scaled and upgraded on its own, with Grafana in front. | Maple |
| Query languages | One visual builder across every signal, SQL through the API and the MCP server when you want it. | PromQL for metrics, LogQL for logs, TraceQL for traces. | Maple |
| Pricing model | $39 a month with 100 GB per signal included, then $0.30 per GB. No per-user fee. | Free tier, then $19 a month plus $8 per active user, $6.50 per thousand active metric series, and $0.55 per GB of logs and traces: $0.05 to process, $0.40 to write and $0.10 to retain for the 30 days. 1 | Maple |
| Per-seat fees | Unlimited. Every engineer, on-call responder and manager gets a login. | $8 per active user beyond the three included on Pro. 1 | Maple |
| Time to first trace | Point an OTLP exporter at Maple and traces start arriving. | Provision each backend, connect each as a data source, then build the first dashboard. | Maple |
| Source code | On GitHub under FSL-1.1, converting to Apache 2.0 two years after each release. One repository for the whole platform. | AGPL-3.0 for Grafana, Loki, Tempo and Mimir. Grafana Cloud itself is proprietary. 2 | Even |
| Self-hosting | One deployment: the platform and its database. | Self-hostable with mature Helm charts, at the cost of operating four services. | Even |
| OpenTelemetry | OTLP in. Nothing else to translate. | OTLP through Alloy or the Collector, fanned out to Tempo, Loki and Mimir. 3 | Even |
| Where Grafana is ahead | |||
| Plugins | No plugin system. Dashboards are built from Maple's own panels. | Hundreds of panel and data-source plugins, dashboards-as-code, and a community library of dashboards for almost anything. 4 | Grafana |
| PromQL compatibility | PromQL for metrics on Maple Cloud. Grafana dashboards import with each panel's first query; Prometheus alert rules don't import yet. | PromQL is the standard for metrics queries. Existing dashboards and recording rules carry over unchanged. | Grafana |
| Non-telemetry data sources | Telemetry only. | Query Postgres, Elasticsearch, CloudWatch and dozens more from one panel. 4 | Grafana |
| On-call | On-call schedules with overrides, escalation chains that page until someone acknowledges, and maintenance windows, with no per-responder fee. Pages go out by email and Slack or Discord message, not phone or SMS. | Grafana IRM with on-call schedules, escalation chains and incident timelines. 5 | Grafana |
In production : Superwall sends Maple more than 80 billion traces, logs and metrics a month, about 18 TB, with nothing sampled out. Read the Superwall story
Enterprise : Custom volume pricing and retention, priority support, SSO (SAML/OIDC) with SCIM provisioning, and Bring Your Own Cloud to run Maple in your own cloud account. See pricing
Surfaces
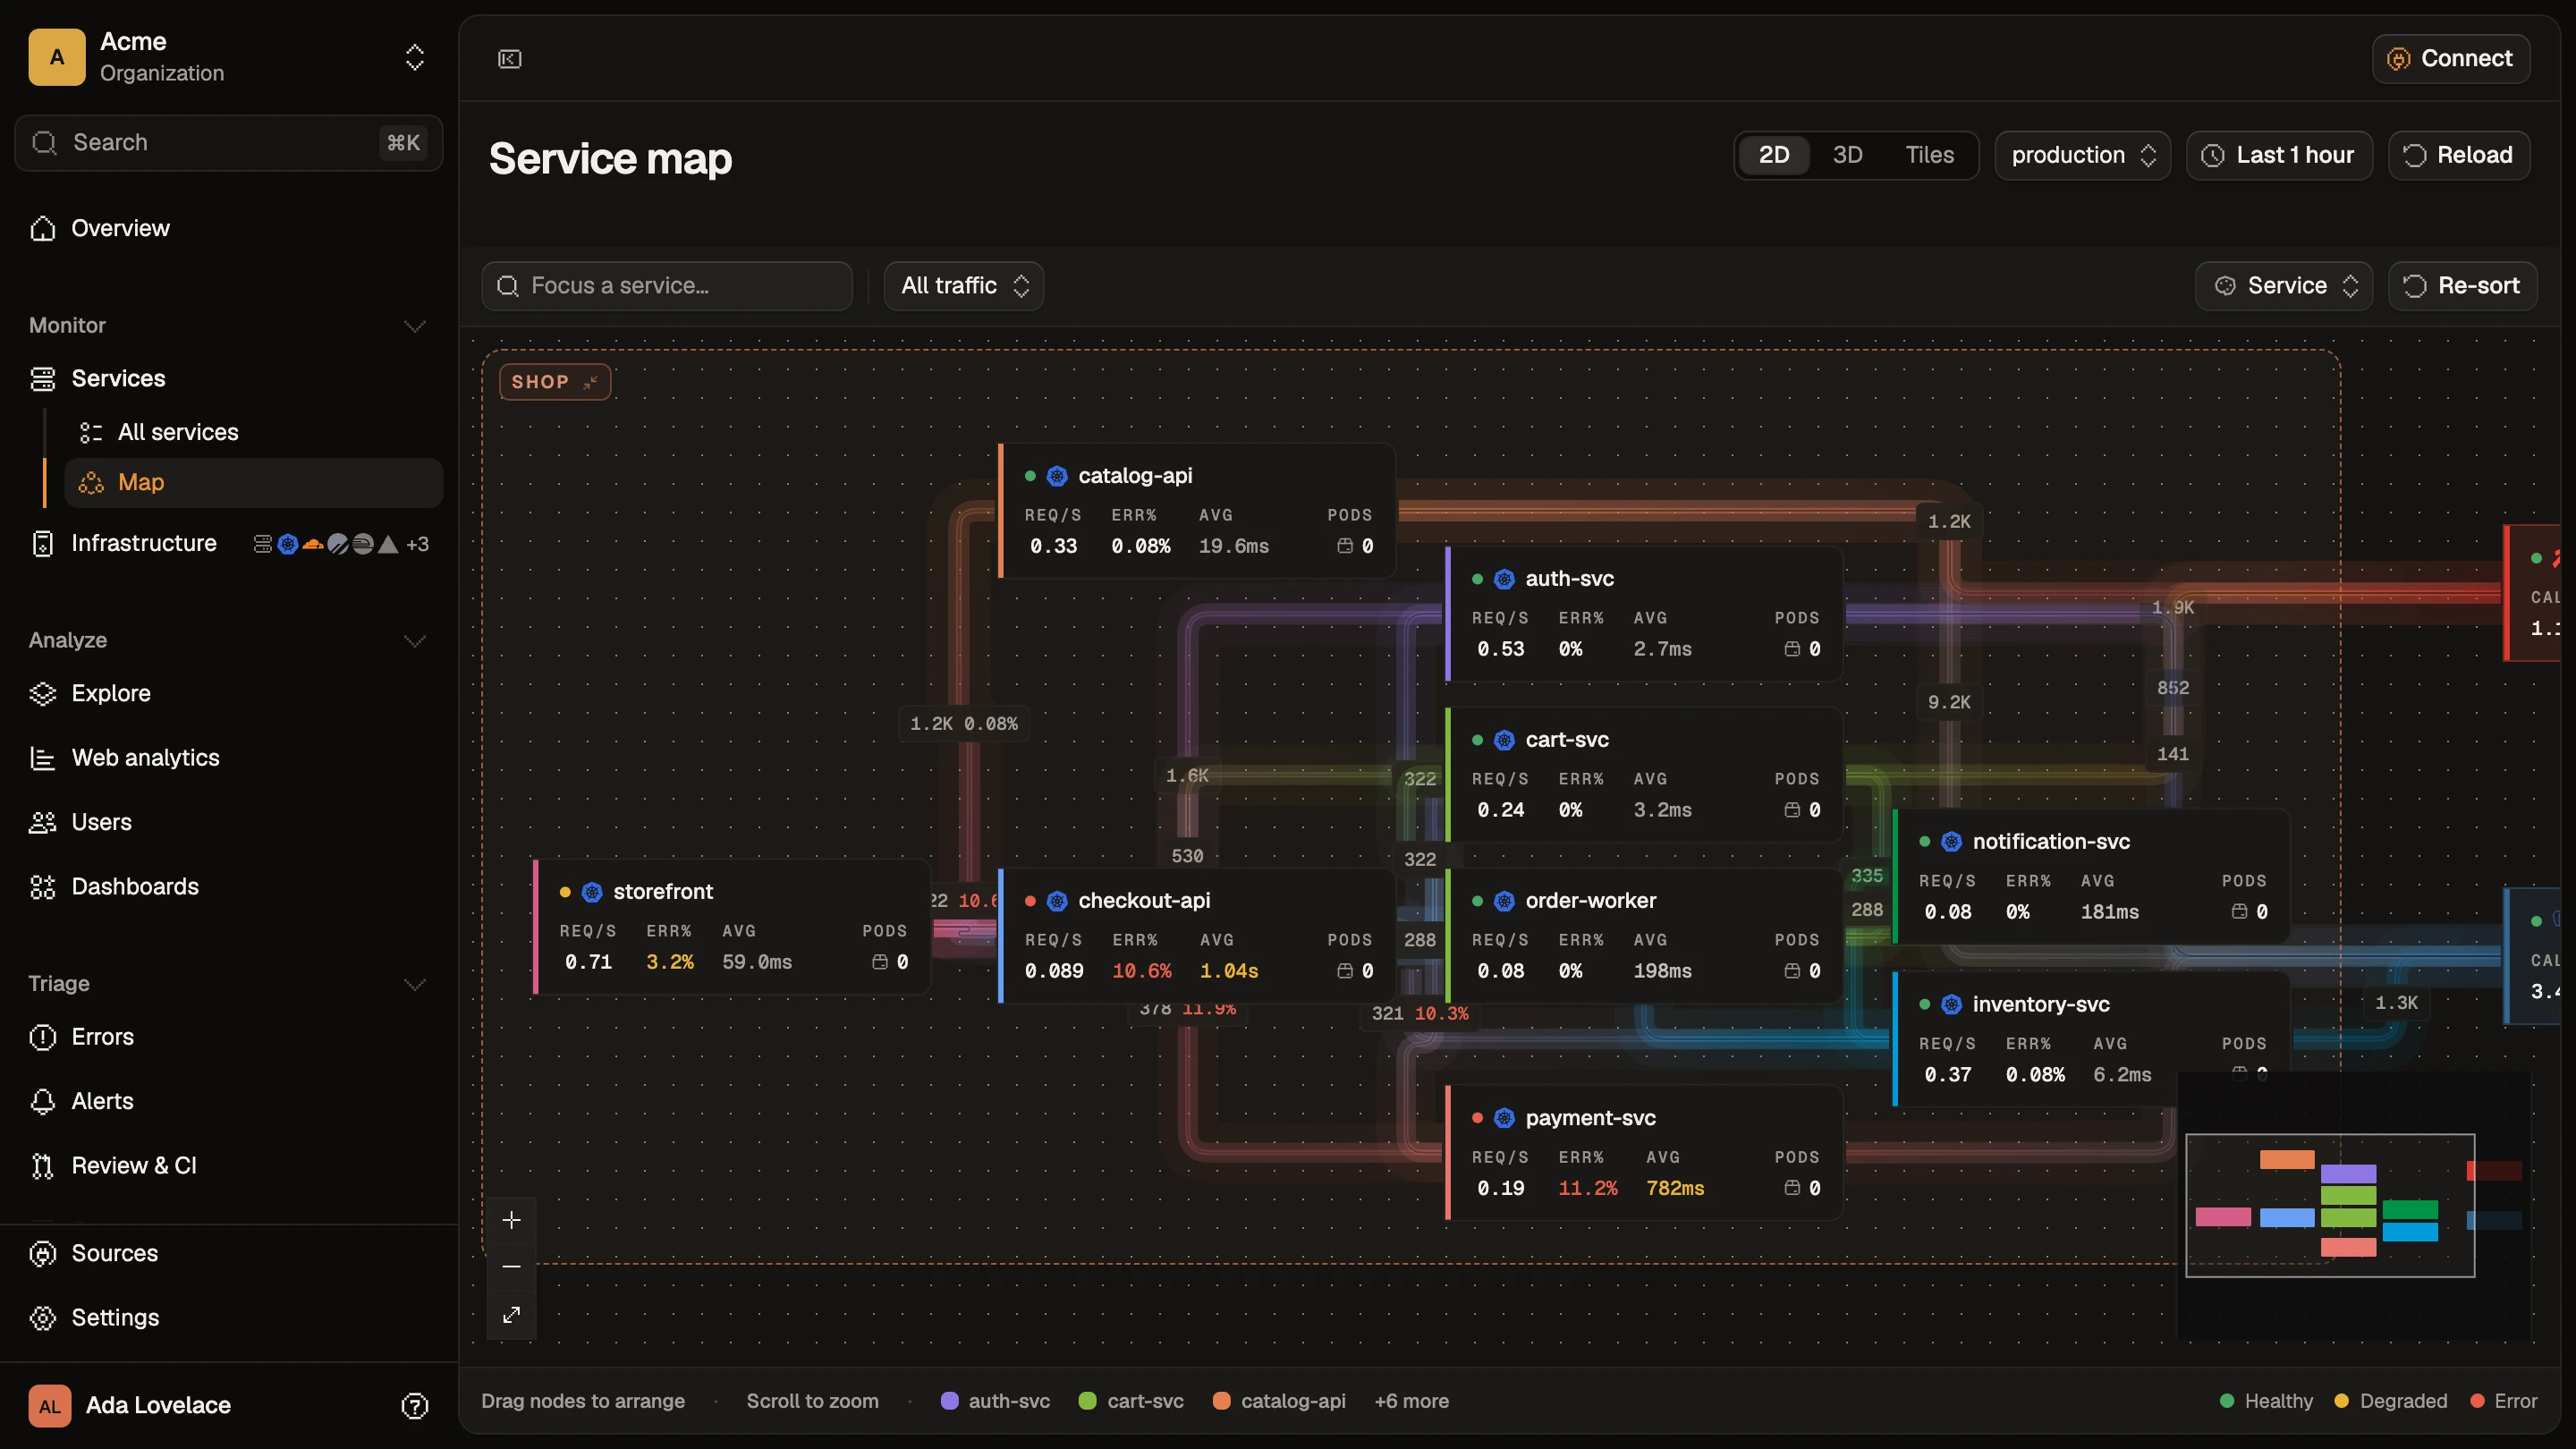
Every service, queue and database, drawn from the spans themselves. There is no topology file to maintain. Edges carry throughput, error rate and latency, and clicking one opens the traces behind it.
Price
A reference workload priced on both at list price. Change the sliders underneath for your own numbers.
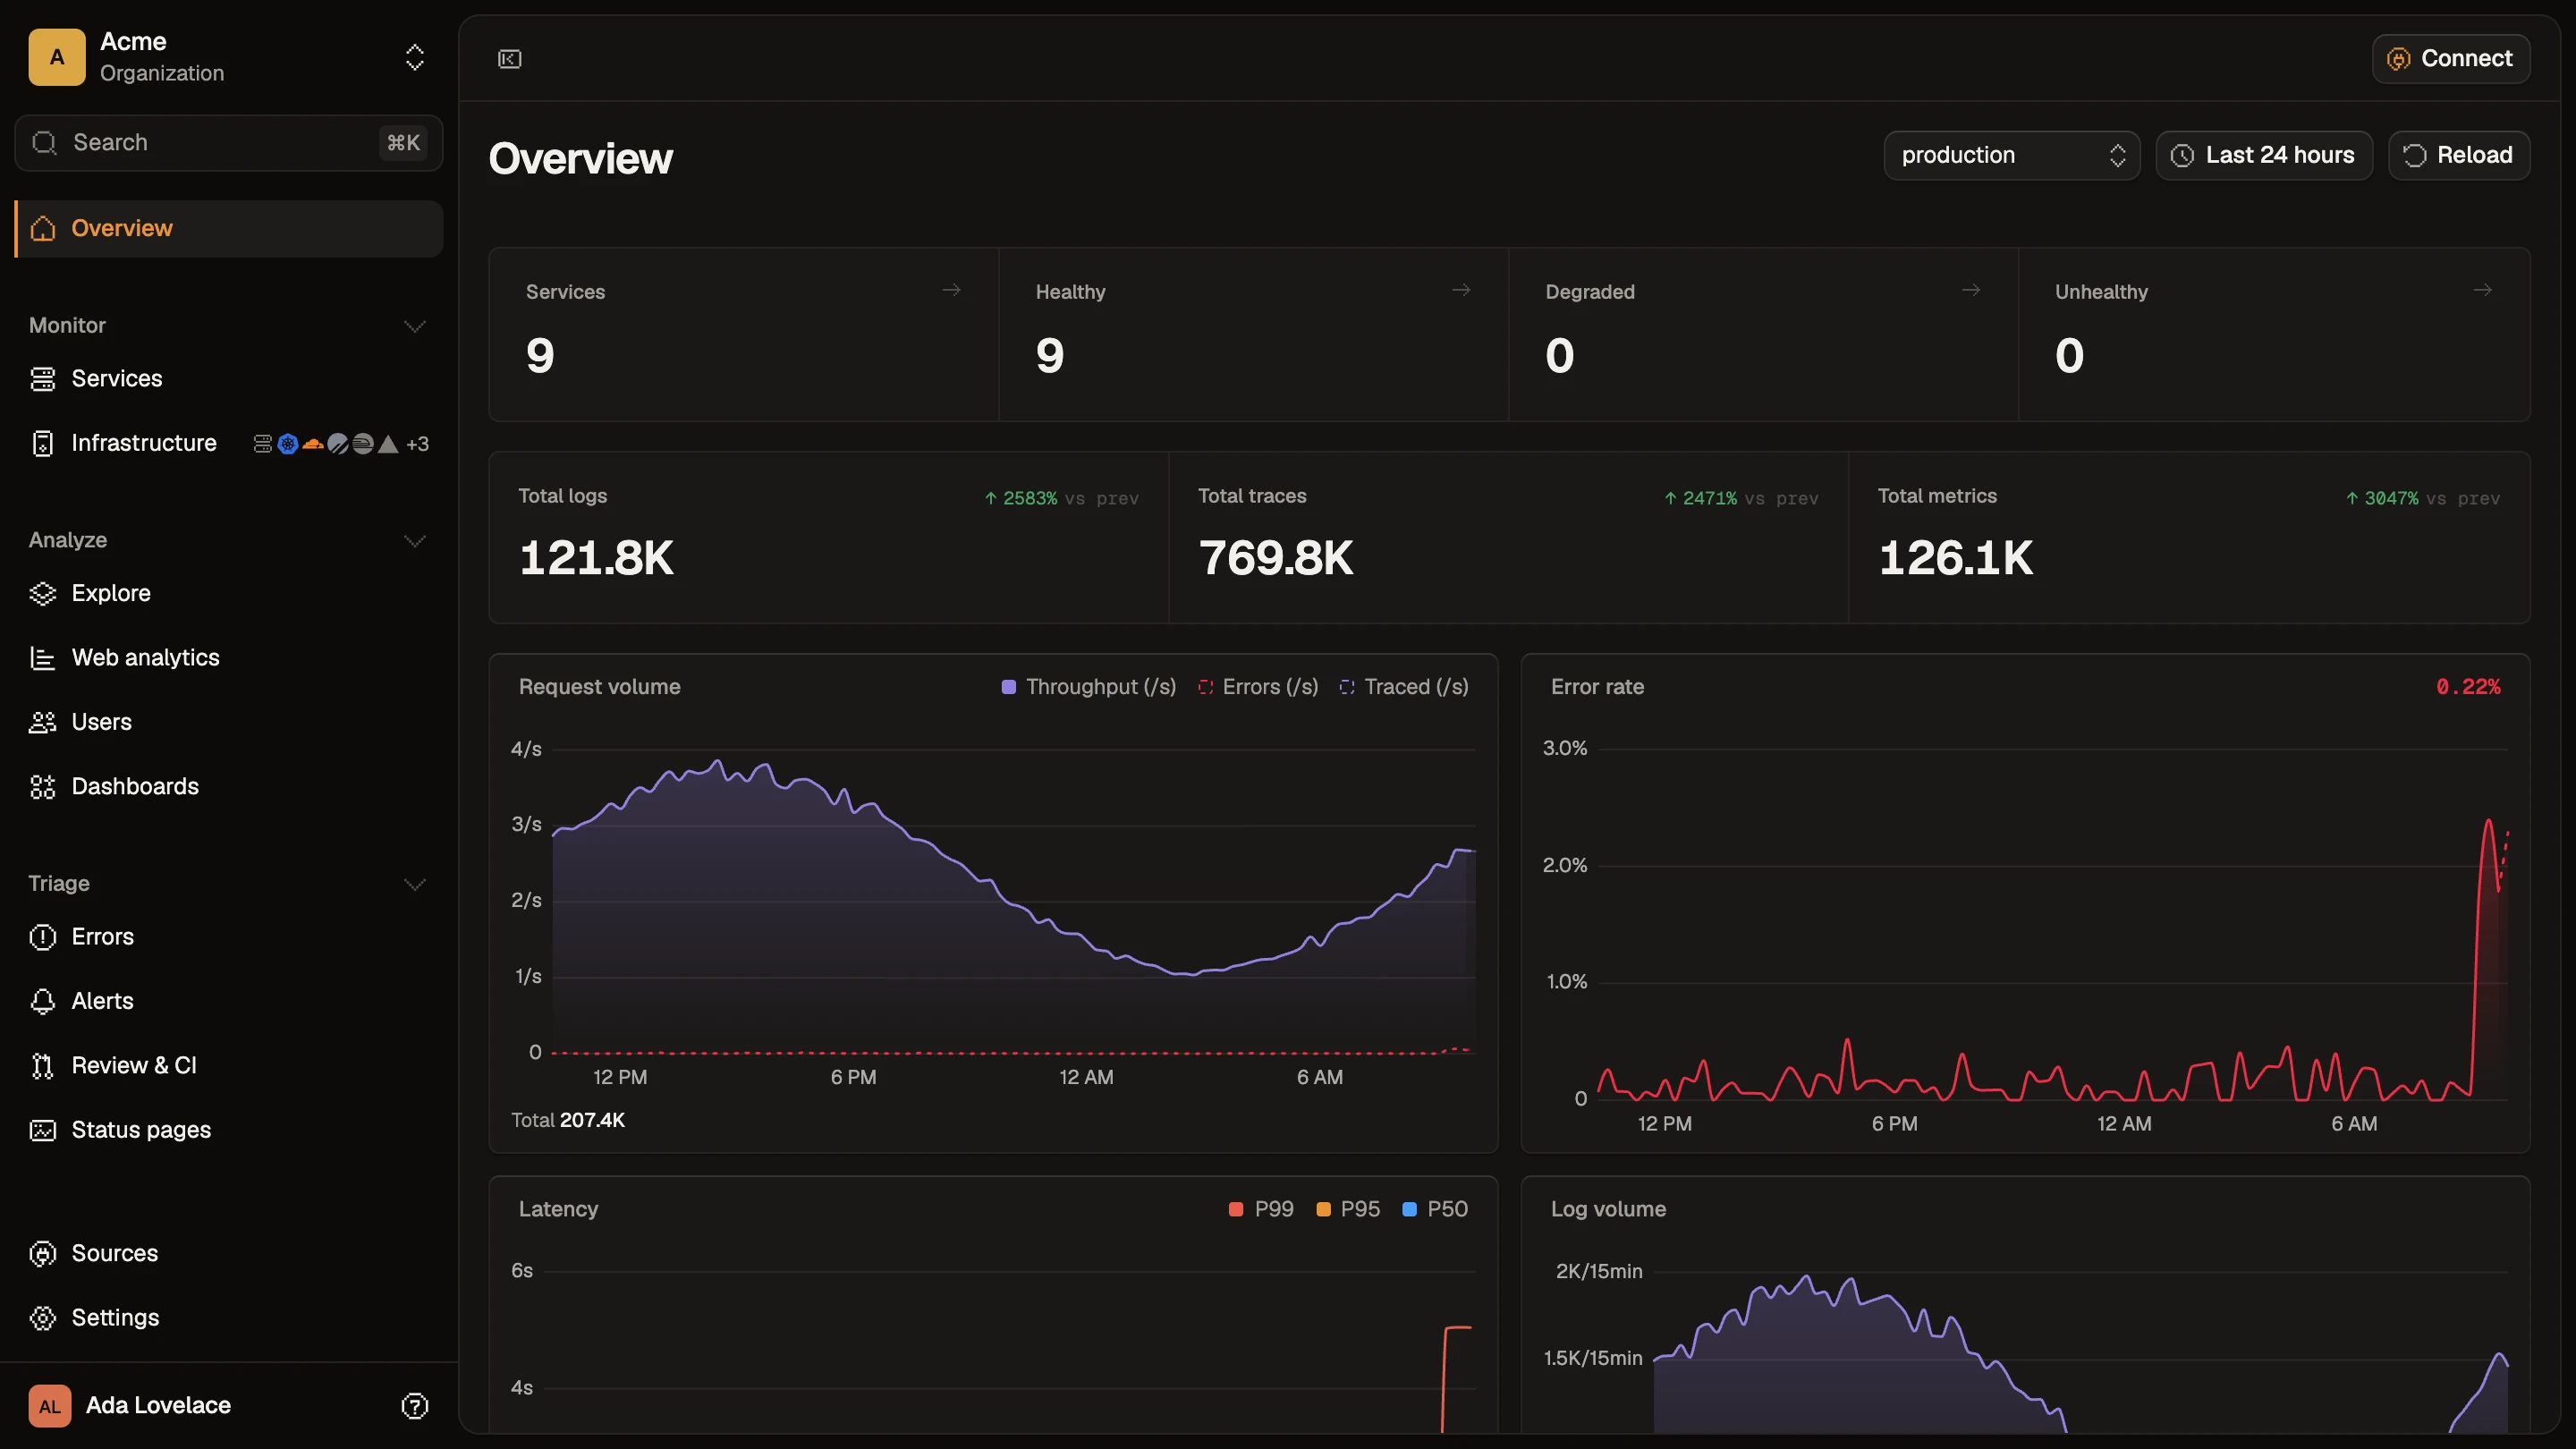
Reference workload Active metric series 50 k series · Log volume 100 GB/mo · Trace volume 100 GB/mo · Team size 10 users
$74 per month
| Startup plan 100 GB per signal included | $39 |
|---|---|
| Overage 116 GB over × $0.30 | $35 |
| Team seats No per-seat fees | Free |
| Total | $74 |
$390 per month
| Platform fee Base plan | $19 |
|---|---|
| Metrics 50k series (10k free) | $260 |
| Logs 100 GB (50 GB free) | $28 |
| Traces 100 GB (50 GB free) | $28 |
| Users 10 users × $8 (3 free) | $56 |
| Total | $390 |
$316 less per month on Maple · $3.8k a year
Adjust for your usage
List prices checked September 2026. Sources at the foot of the page. Maple pricing based on the Startup plan ($39/mo with 100 GB included per signal (logs, traces, metrics), then $0.30/GB, billed per signal), metered on uncompressed (decoded OTLP) bytes. Grafana bills active series at one data point a minute, so the Maple estimate converts 1k series to about 4.32 GB a month at 0.1 KB per decoded data point. Grafana's $0.55/GB is process, write and retain at the plan's 30 days.
Migration
Telemetry moves with one exporter change. Dashboards and alert rules don't cross vendors, so plan those as the real work.
If Alloy or the OpenTelemetry Collector already feeds Tempo, Loki and Mimir, add an OTLP exporter to Maple and run both until the alerts you care about fire from Maple.
Grafana JSON imports: each panel keeps its first query, rows become sections, and an import report lists anything Maple cannot run yet, extra queries included. Read log panels' lines on the Logs page, rebuild the rest in Maple's builder, and let the long tail of unused dashboards lapse.
Turn off Loki, Tempo, Mimir and Grafana once Maple is the source of truth. That is four services fewer to upgrade, scale and page on.
exporters: otlp/tempo: endpoint: tempo:4317 otlp_http/maple: endpoint: https://ingest.maple.dev headers: x-maple-ingest-key: ${env:MAPLE_INGEST_KEY} service: pipelines: traces: exporters: [otlp/tempo, otlp_http/maple] logs: exporters: [otlp/tempo, otlp_http/maple] metrics: exporters: [otlp/tempo, otlp_http/maple]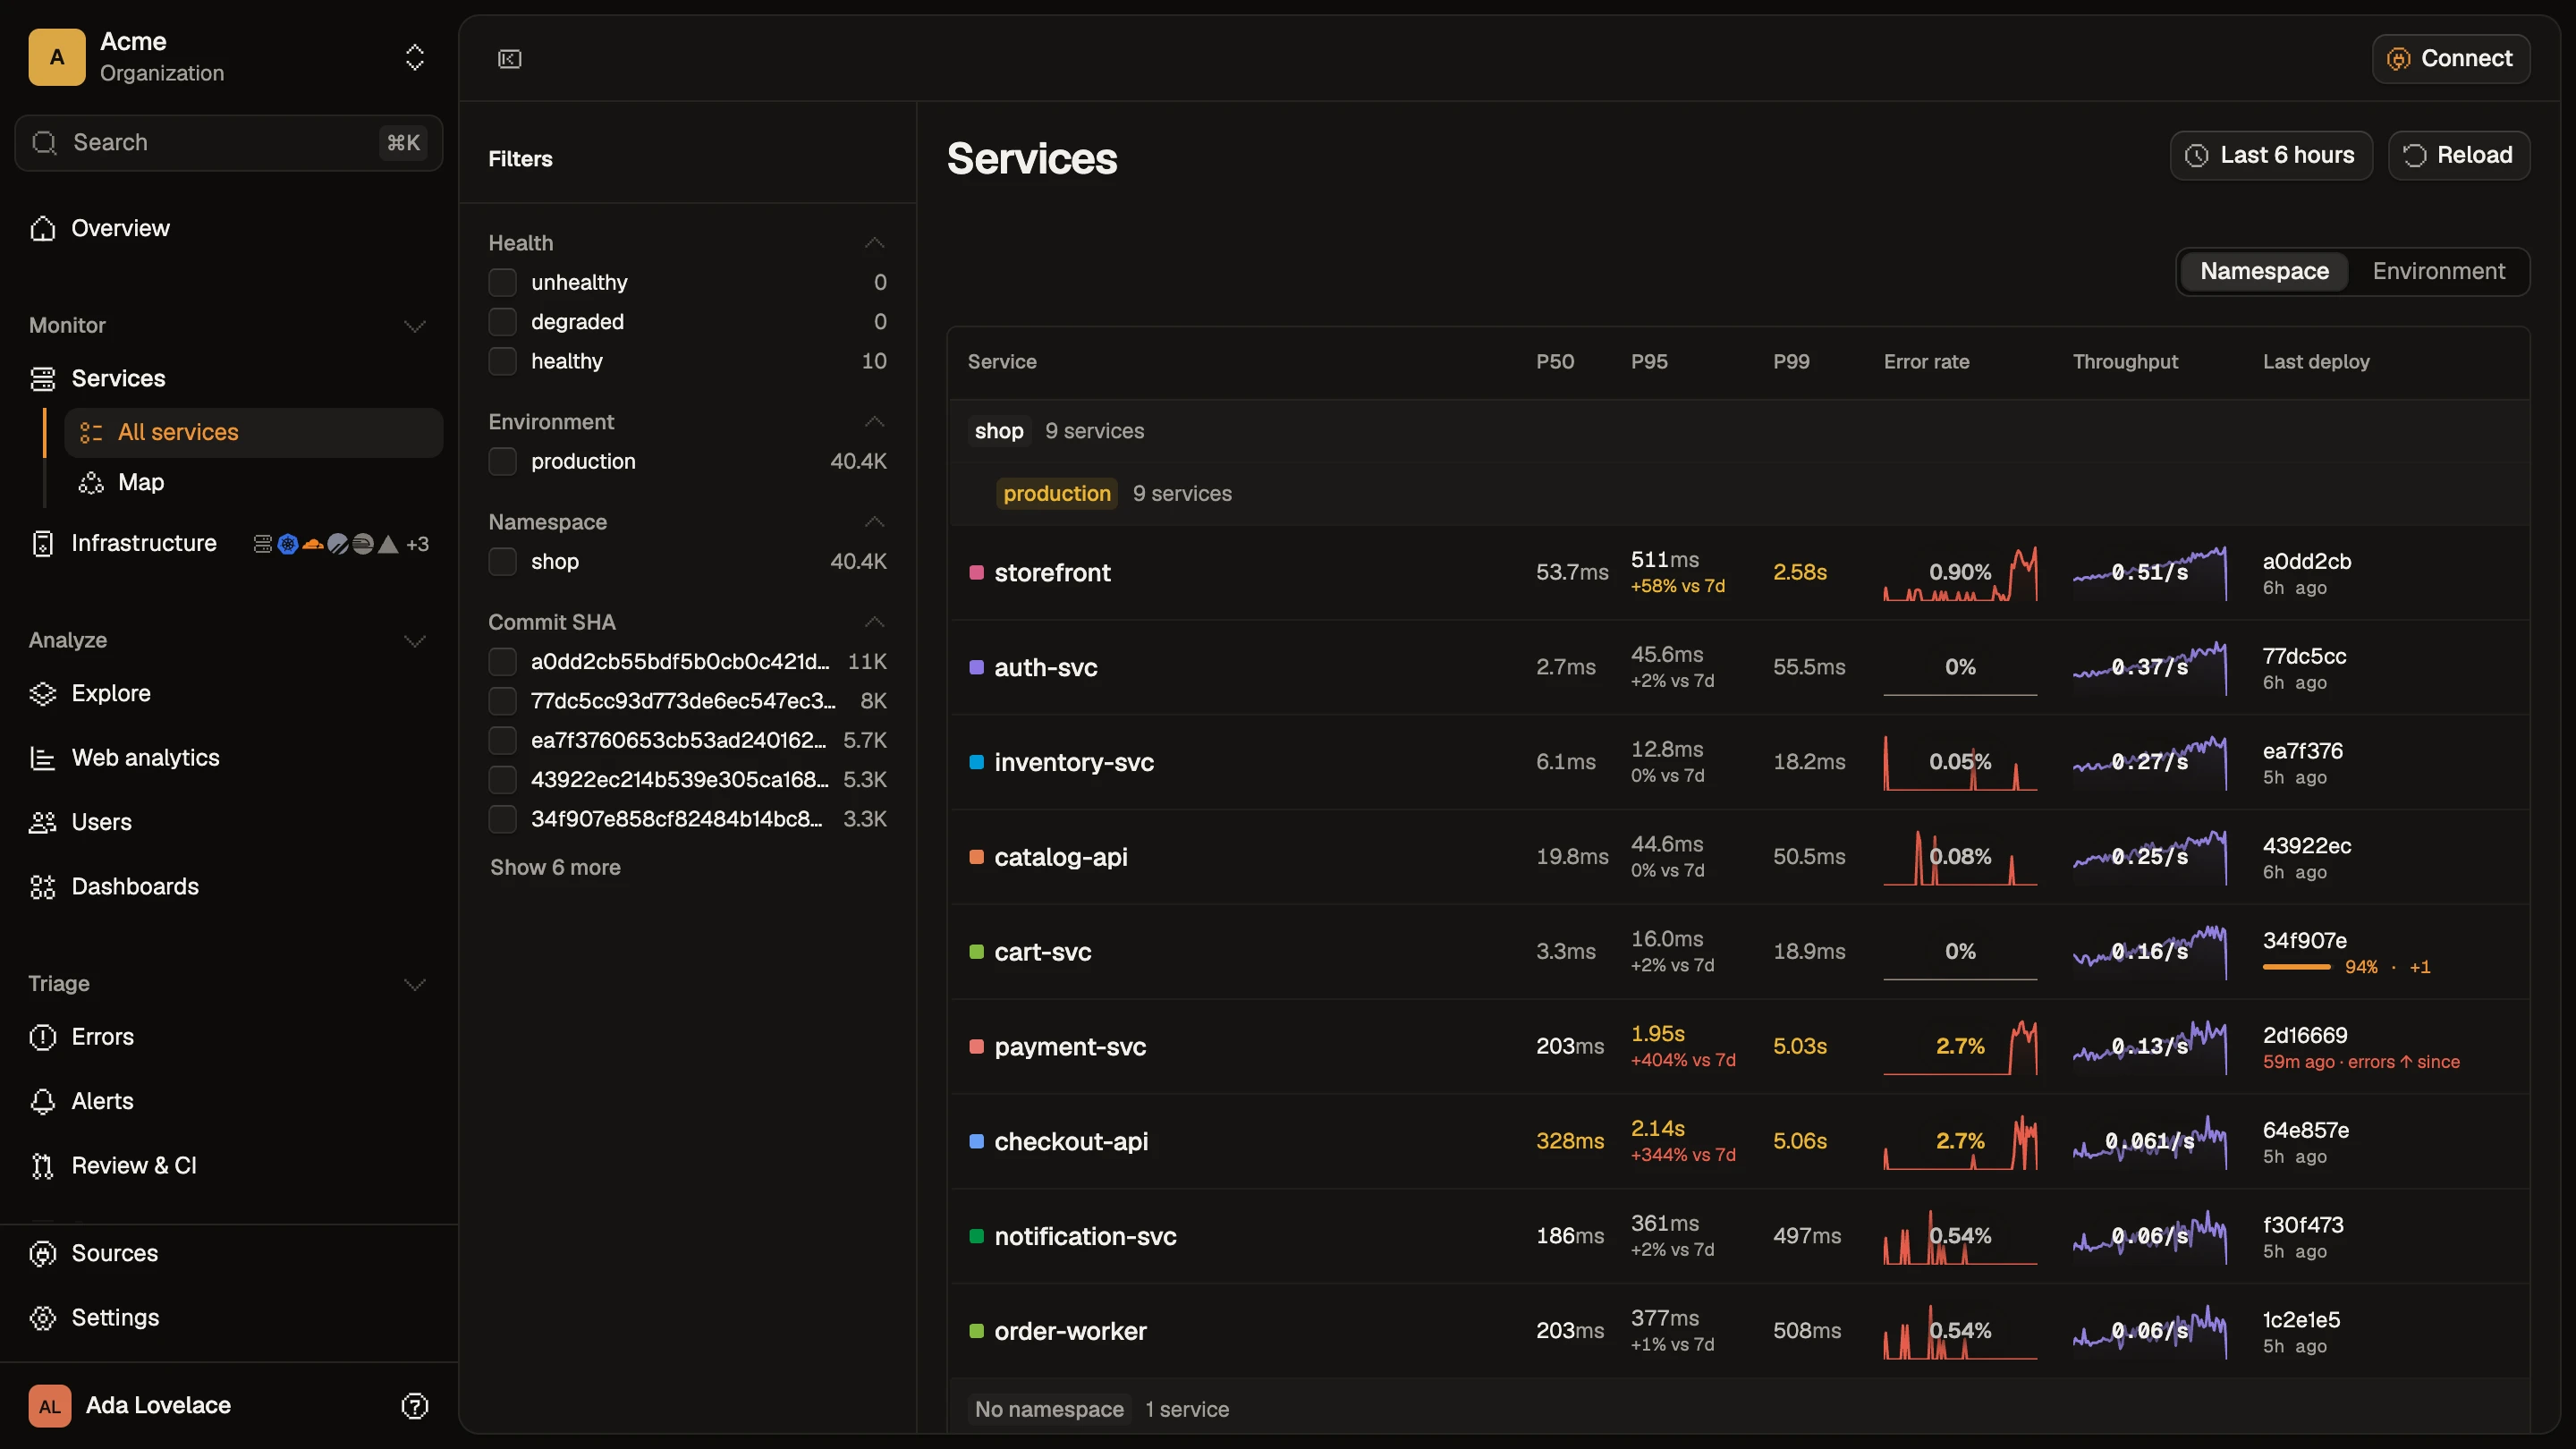
Sources
Vendor facts on this page link to the vendor's own pages and carry the month they were last checked. If one is stale, tell us.
Compare
7 tools compared, and when to stay on Grafana
Source on GitHub, no per-host billing
OTel-native, no per-user fees
Source available and self-hostable
Issues, session replay, one local binary
Issues, session replay, self-hosting
Source code, self-hosting, local mode
Session replay, self-hosting, price per GB

Point one exporter at Maple and run both for a week. The free trial needs a card, with no charge until it ends.