Maple
$39 per month
| Startup plan 100 GB per signal included | $39 |
|---|---|
| Team seats No per-seat fees | Free |
| Total | $39 |
Dash0 and Maple start from the same place: OpenTelemetry in, usage-based pricing, no per-seat fees for observability, an MCP server for agents. The difference is ownership: Maple's source is public and you can self-host it, while Dash0 is a closed SaaS.
Surfaces
Dash0 is OpenTelemetry-native too, so the signals match. The difference is where the platform runs and what ships beside the telemetry.
One binary with an embedded ClickHouse. `maple start` runs the platform locally with no containers and no account, and self-hosting is one container on your own infrastructure.
On Dash0: the platform is SaaS only, in Dash0-operated regions. SignalControl Edge can filter data in your own cluster before it is sent on.
See the surface →HTTP, TCP and DNS checks as often as every 30 seconds, plus cron heartbeats. A failed HTTP check opens as a trace of the request inside your app.
On Dash0: synthetic API checks at $0.20 per thousand runs, retained 13 months.
See the surface →A hosted MCP server runs the dashboard's own queries for Claude, Cursor or any agent, and investigations diagnose an alert or issue and write up what broke.
On Dash0: an MCP server and AI-assisted views.
See the surface →Differences
The marker beside each row shows which tool is ahead on it. Rows where both do the same thing are grouped into one line at the end.
| Topic | Maple | Dash0 | Edge |
|---|---|---|---|
| Where they differ | |||
| Source code | On GitHub under FSL-1.1, converting to Apache 2.0 two years after each release. | Closed. Dash0 open-sources its OpenTelemetry distribution and Kubernetes operator, not the platform. 2 | Maple |
| Self-hosting | Yes. One container on your own infrastructure for one team. Alerting and team accounts are on Cloud only for now. | No. The platform is SaaS only, in Dash0-operated regions. SignalControl Edge, a filtering collector, can run in your own cluster before data is sent on. 4 | Maple |
| Pricing model | $39 a month with 100 GB per signal included, then $0.30 per GB. | Per data point: $0.60 per million spans or log records ($0.06 ingestion plus $0.54 storage at 30-day retention) and $0.20 per million metric data points ($0.02 plus $0.18 at 13-month retention). 1 | Even |
| AI and agents | Investigations that diagnose an alert or issue and write up what broke, plus a hosted MCP server that can also create dashboards, alerts and SLOs. | An MCP server and AI-assisted views. | Even |
| Where Dash0 is ahead | |||
| Retention | 30 days for traces, logs and replays, 90 for metrics, 12 months for service charts. Longer on Enterprise, and your call when you self-host. | 30 days for spans, logs and web events and 13 months for metrics, included in the storage rate. 1 | Dash0 |
| Synthetic monitoring | HTTP, TCP and DNS checks as often as every 30 seconds, plus cron heartbeats. A failed HTTP check opens as a trace. No scripted browser tests. | Synthetic API checks at $0.20 per thousand runs, retained 13 months. 1 | Dash0 |
| PromQL compatibility | PromQL for metric queries and dashboards, plus a visual builder and SQL. PromQL alert rules aren't supported yet. | PromQL for metrics and Perses-based dashboards-as-code. 3 | Dash0 |
| Kubernetes tooling | Kubernetes monitoring through the OpenTelemetry Collector. No operator of Maple's own. | A Kubernetes operator and an OpenTelemetry distribution, both maintained in the open. 2 | Dash0 |
In production : Superwall sends Maple more than 80 billion traces, logs and metrics a month, about 18 TB, with nothing sampled out. Read the Superwall story
Enterprise : Custom volume pricing and retention, priority support, SSO (SAML/OIDC) with SCIM provisioning, and Bring Your Own Cloud to run Maple in your own cloud account. See pricing
Surfaces
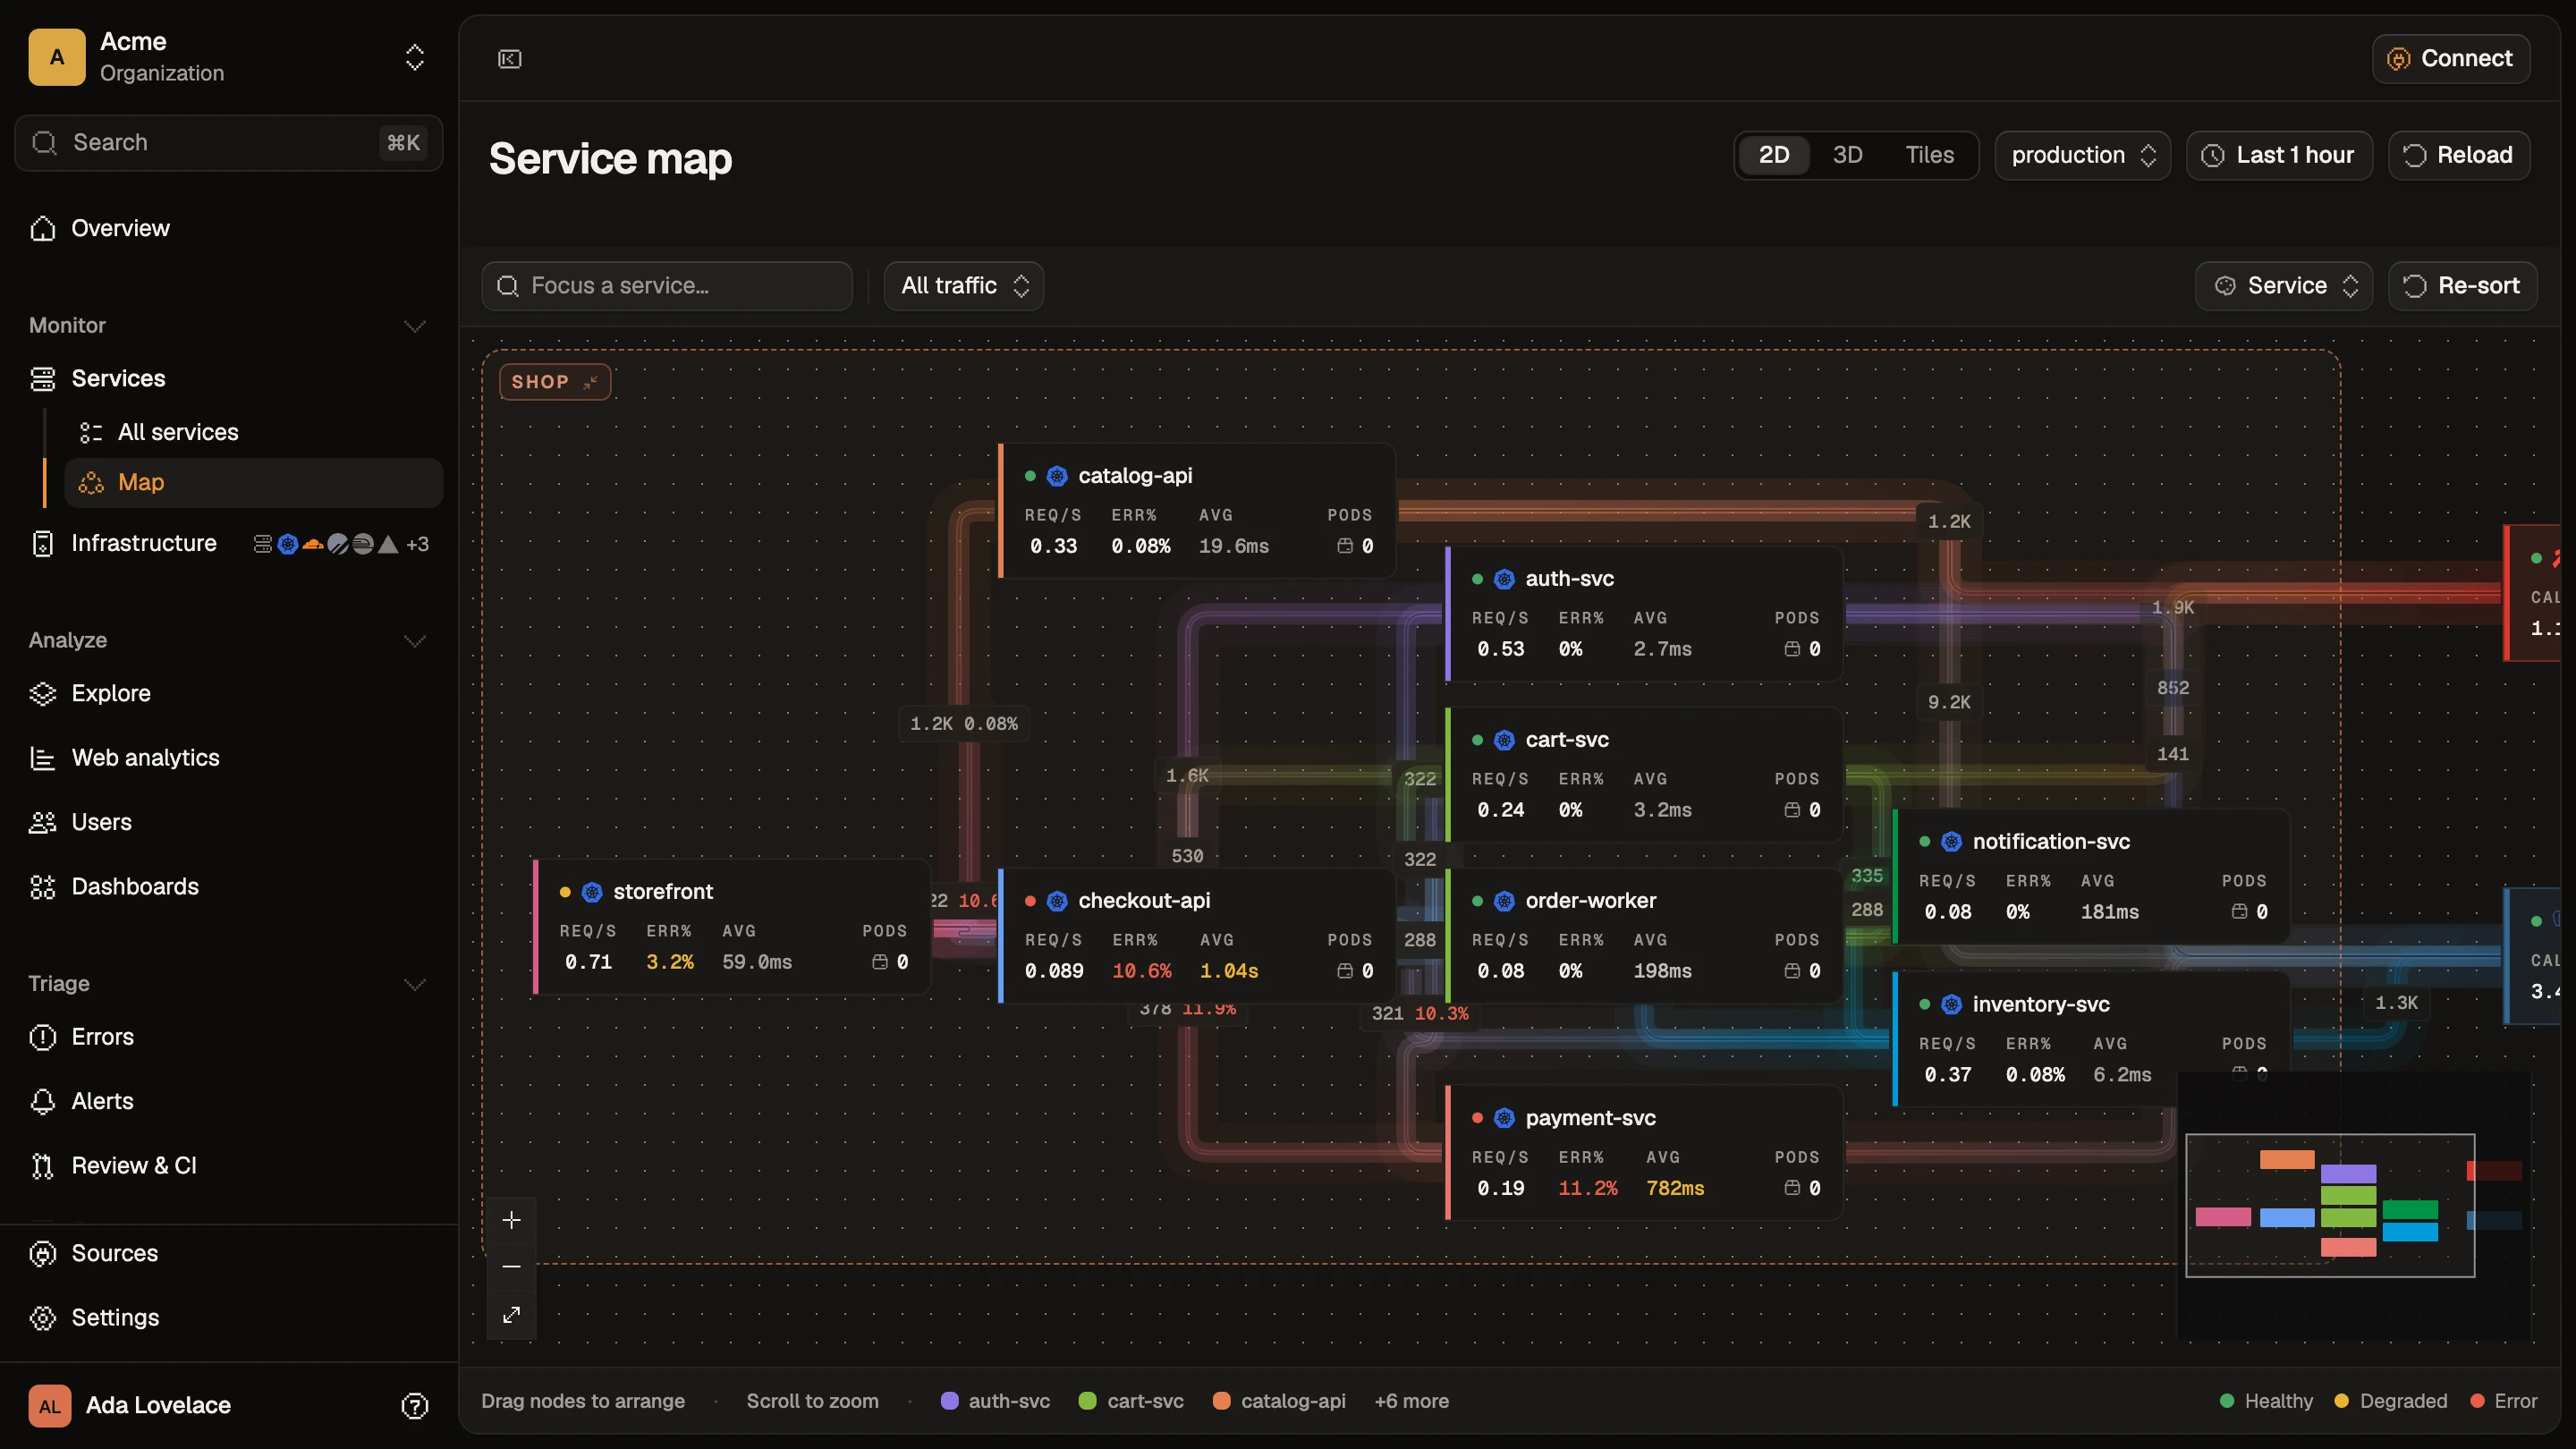
Every service, queue and database, drawn from the spans themselves. There is no topology file to maintain. Edges carry throughput, error rate and latency, and clicking one opens the traces behind it.
Price
A reference workload priced on both at list price. Change the sliders underneath for your own numbers.
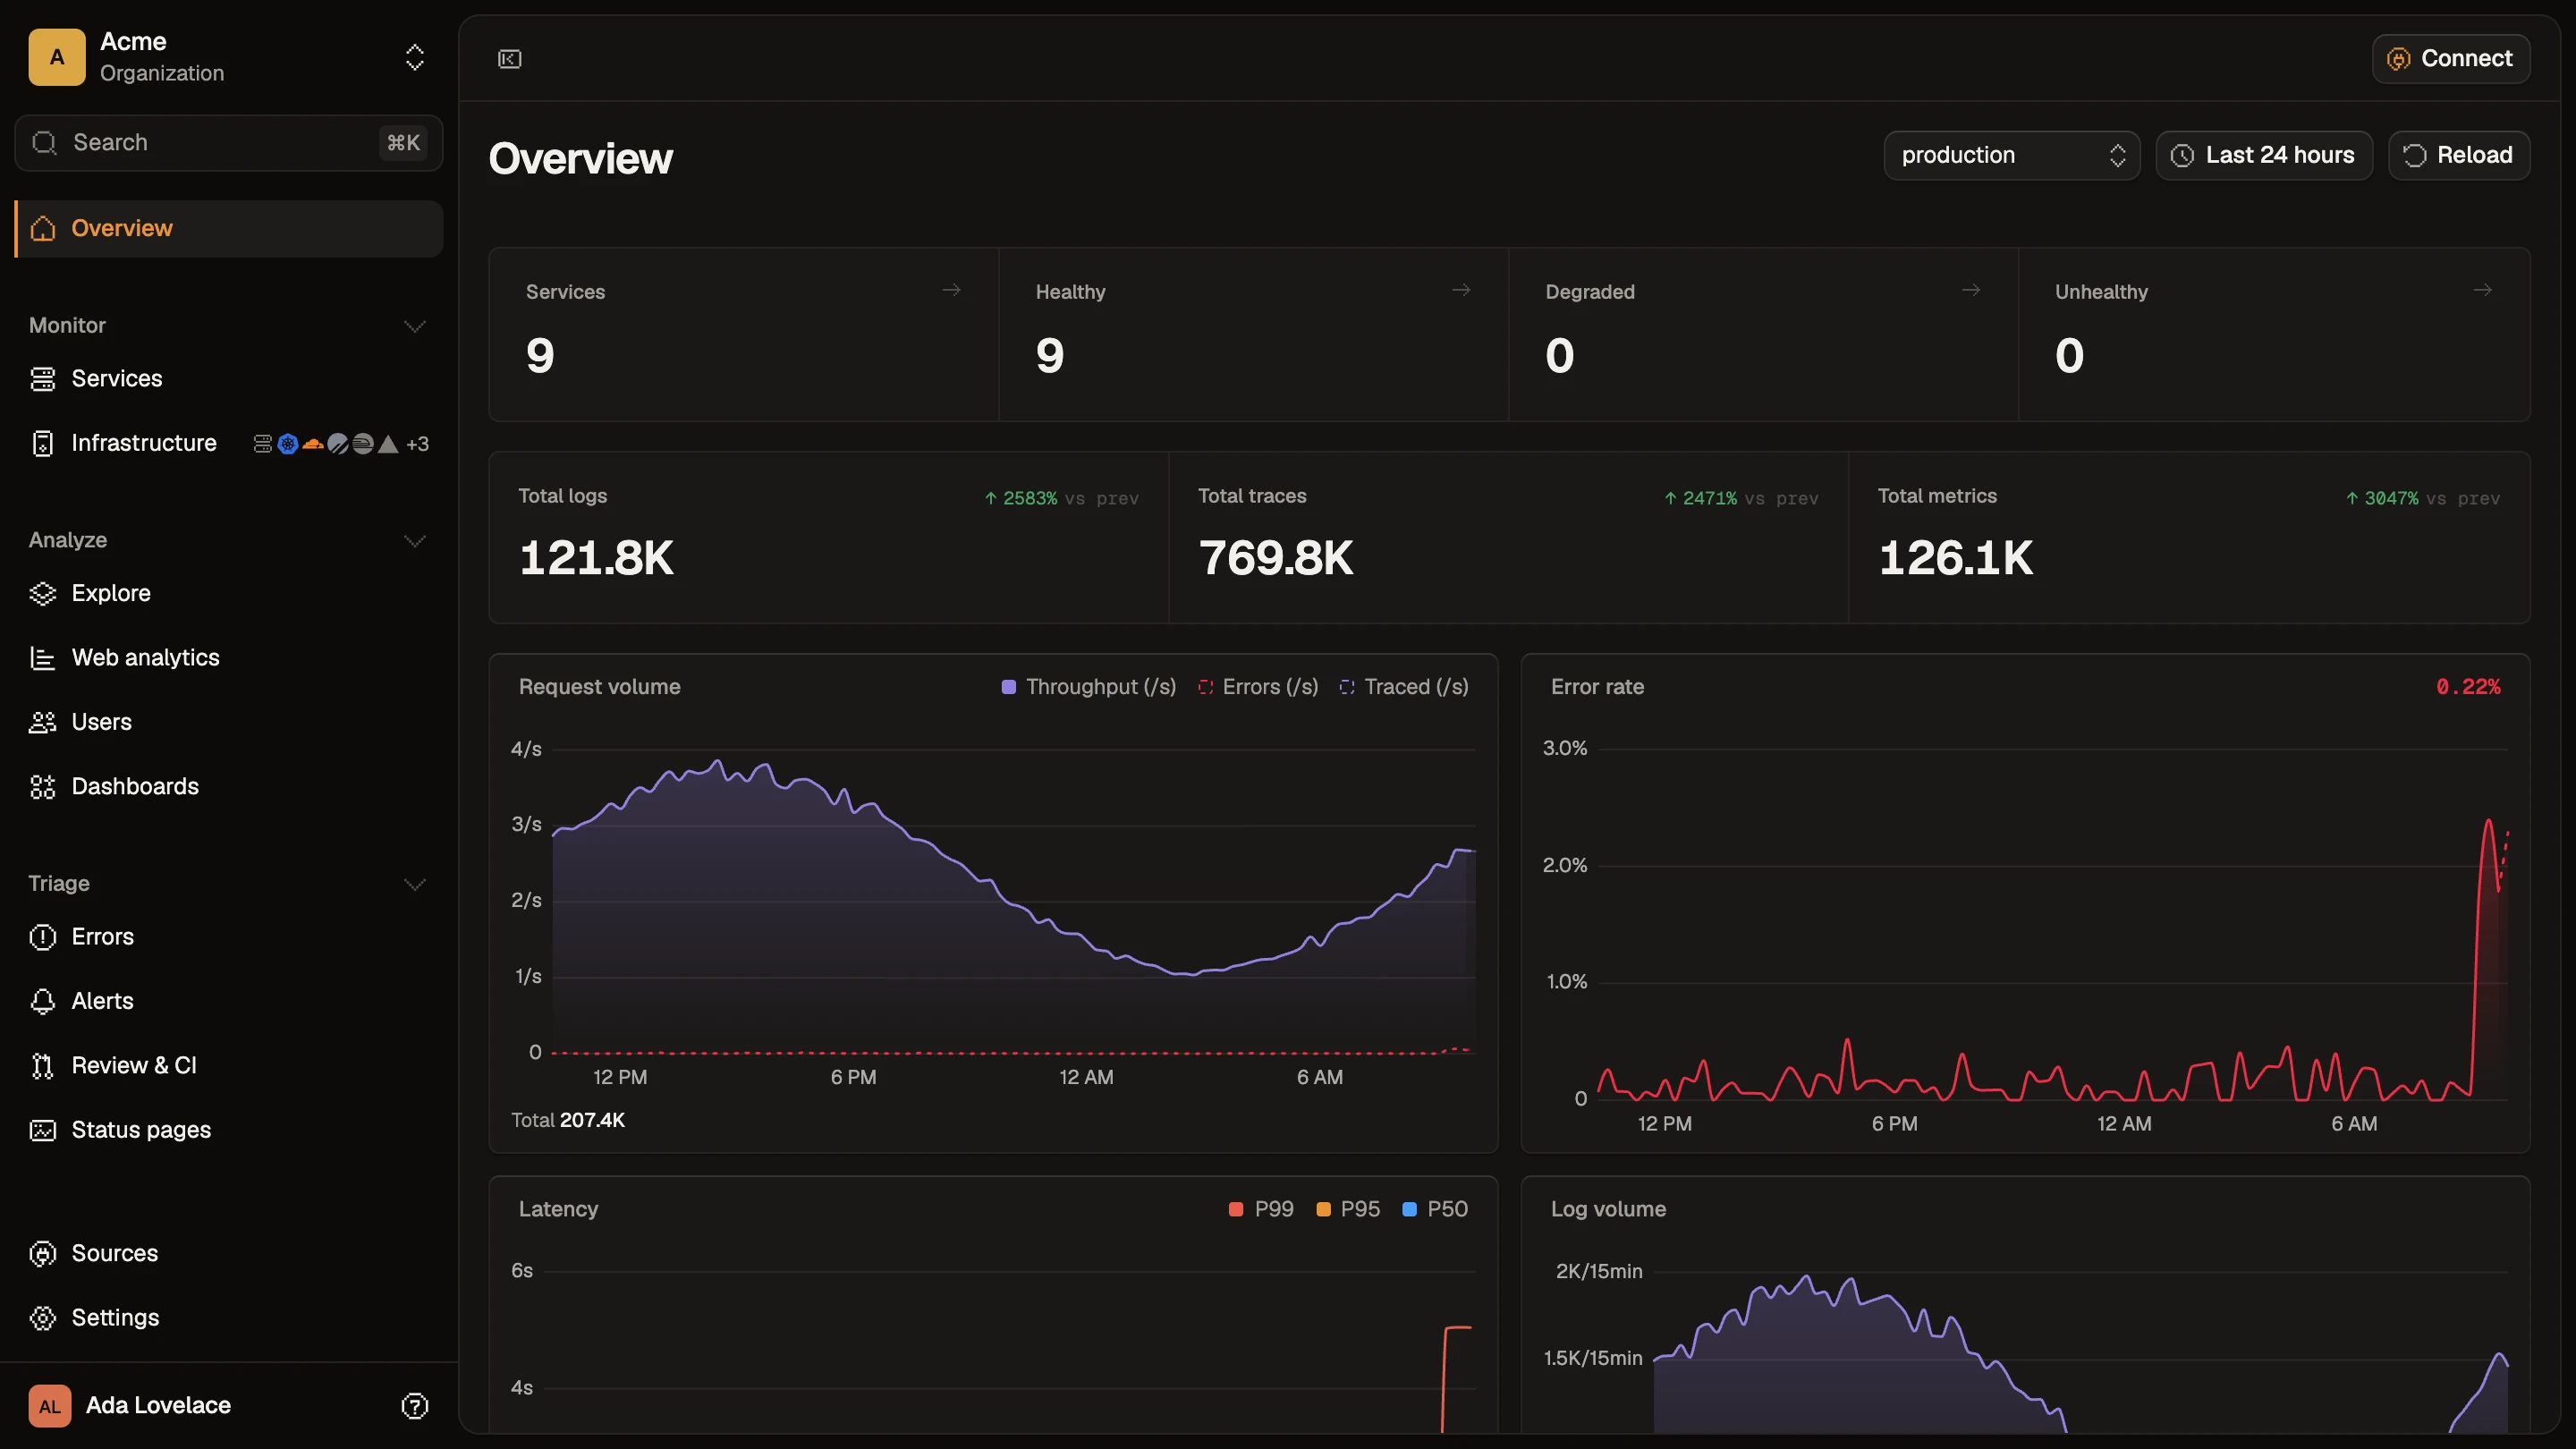
Reference workload Spans / mo 100 M · Log records / mo 100 M · Metric data points / mo 500 M
$39 per month
| Startup plan 100 GB per signal included | $39 |
|---|---|
| Team seats No per-seat fees | Free |
| Total | $39 |
$220 per month
| Spans 100M × $0.60/M | $60 |
|---|---|
| Logs 100M × $0.60/M | $60 |
| Metrics 500M × $0.20/M | $100 |
| Total | $220 |
$181 less per month on Maple · $2.2k a year
Adjust for your usage
List prices checked September 2026. Sources at the foot of the page. Maple pricing based on the Startup plan ($39/mo with 100 GB included per signal (logs, traces, metrics), then $0.30/GB, billed per signal), metered on uncompressed (decoded OTLP) bytes. Dash0 bills per data point, ingestion plus storage at the default retention. The Maple estimate converts at 1 KB per span or log record and 0.1 KB per metric data point; your ratio depends on attribute sizes.
Migration
Telemetry moves with one exporter change. Dashboards and alert rules don't cross vendors, so plan those as the real work.
Both platforms ingest standard OTLP, so SDKs, auto-instrumentation and semantic conventions carry over unchanged.
Add Maple next to the Dash0 exporter in the Collector and ship to both while you verify.
Dashboards, saved views and alert rules don't travel over OTLP. Rebuild the ones that matter in Maple; the MCP server can draft them.
exporters: otlp/dash0: endpoint: ingress.eu-west-1.aws.dash0.com:4317 headers: Authorization: Bearer ${env:DASH0_AUTH_TOKEN} otlp_http/maple: endpoint: https://ingest.maple.dev headers: x-maple-ingest-key: ${env:MAPLE_INGEST_KEY} service: pipelines: traces: exporters: [otlp/dash0, otlp_http/maple] logs: exporters: [otlp/dash0, otlp_http/maple] metrics: exporters: [otlp/dash0, otlp_http/maple]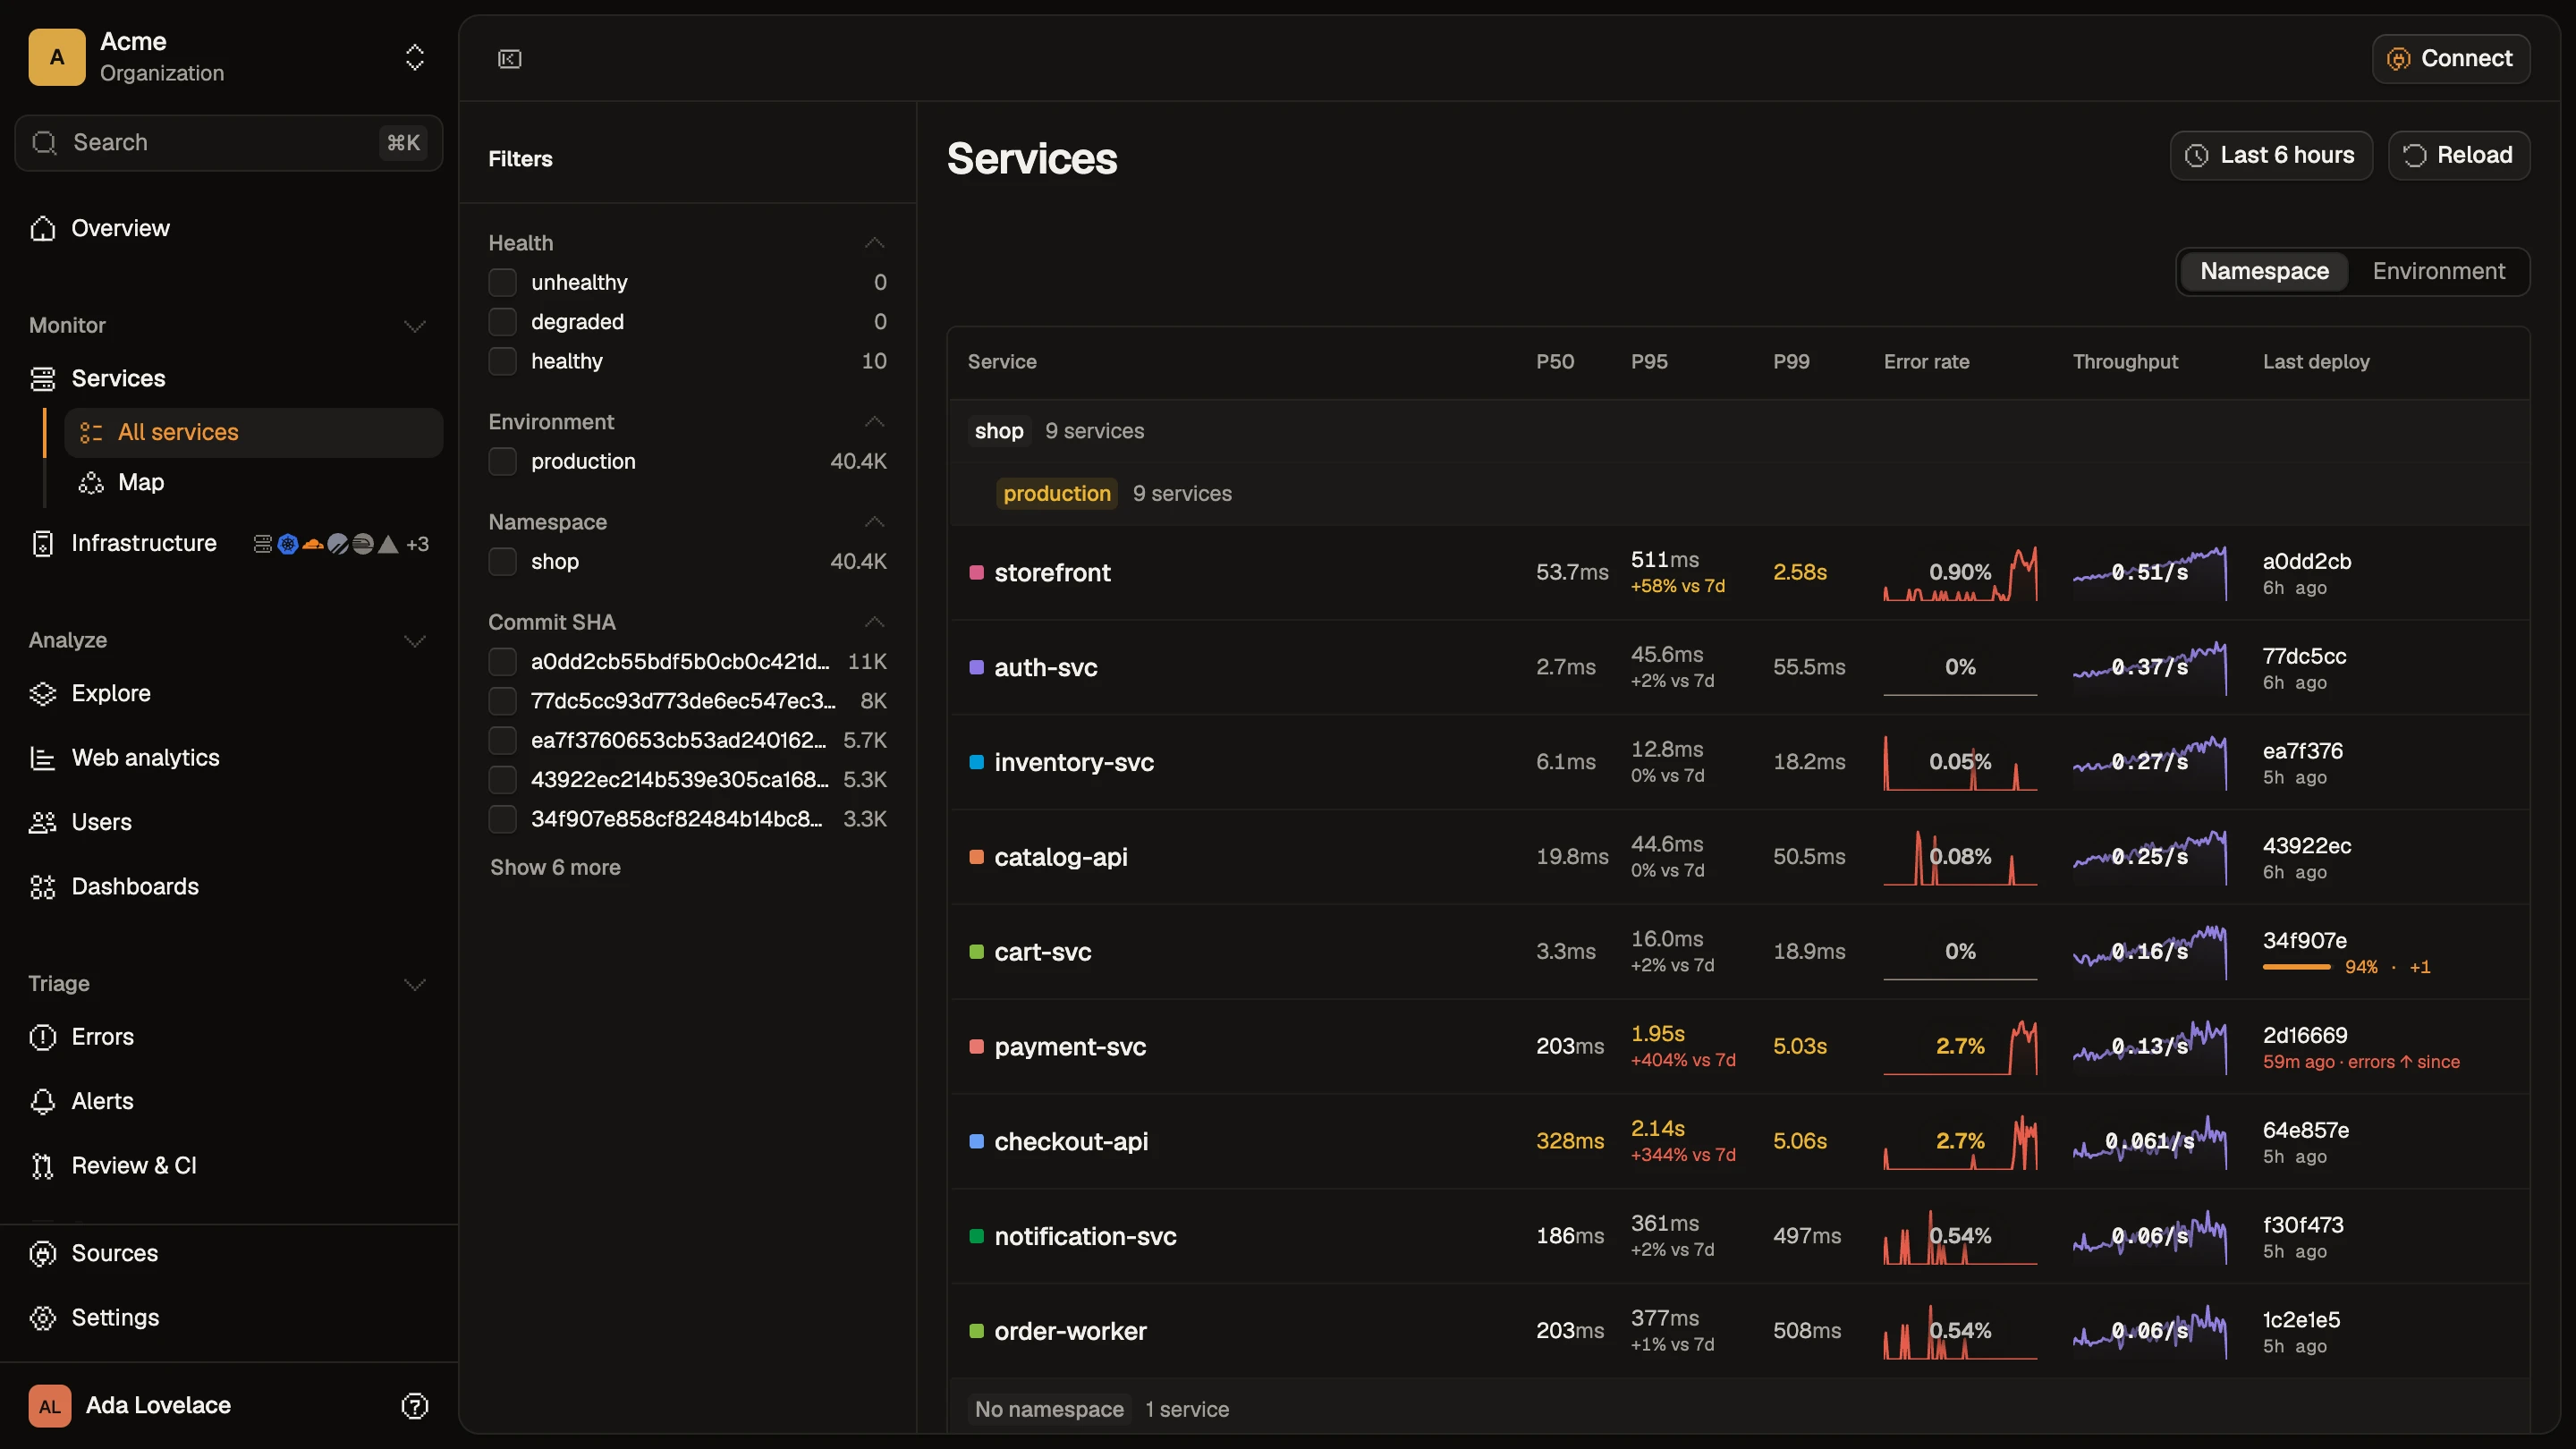
Sources
Vendor facts on this page link to the vendor's own pages and carry the month they were last checked. If one is stale, tell us.
Compare
8 tools compared, and when to stay on Dash0
Source on GitHub, no per-host billing
One platform, nothing to assemble
OTel-native, no per-user fees
Issues, session replay, one local binary
Issues, session replay, self-hosting
Source code, self-hosting, local mode
Session replay, self-hosting, price per GB

Point one exporter at Maple and run both for a week. The free trial needs a card, with no charge until it ends.