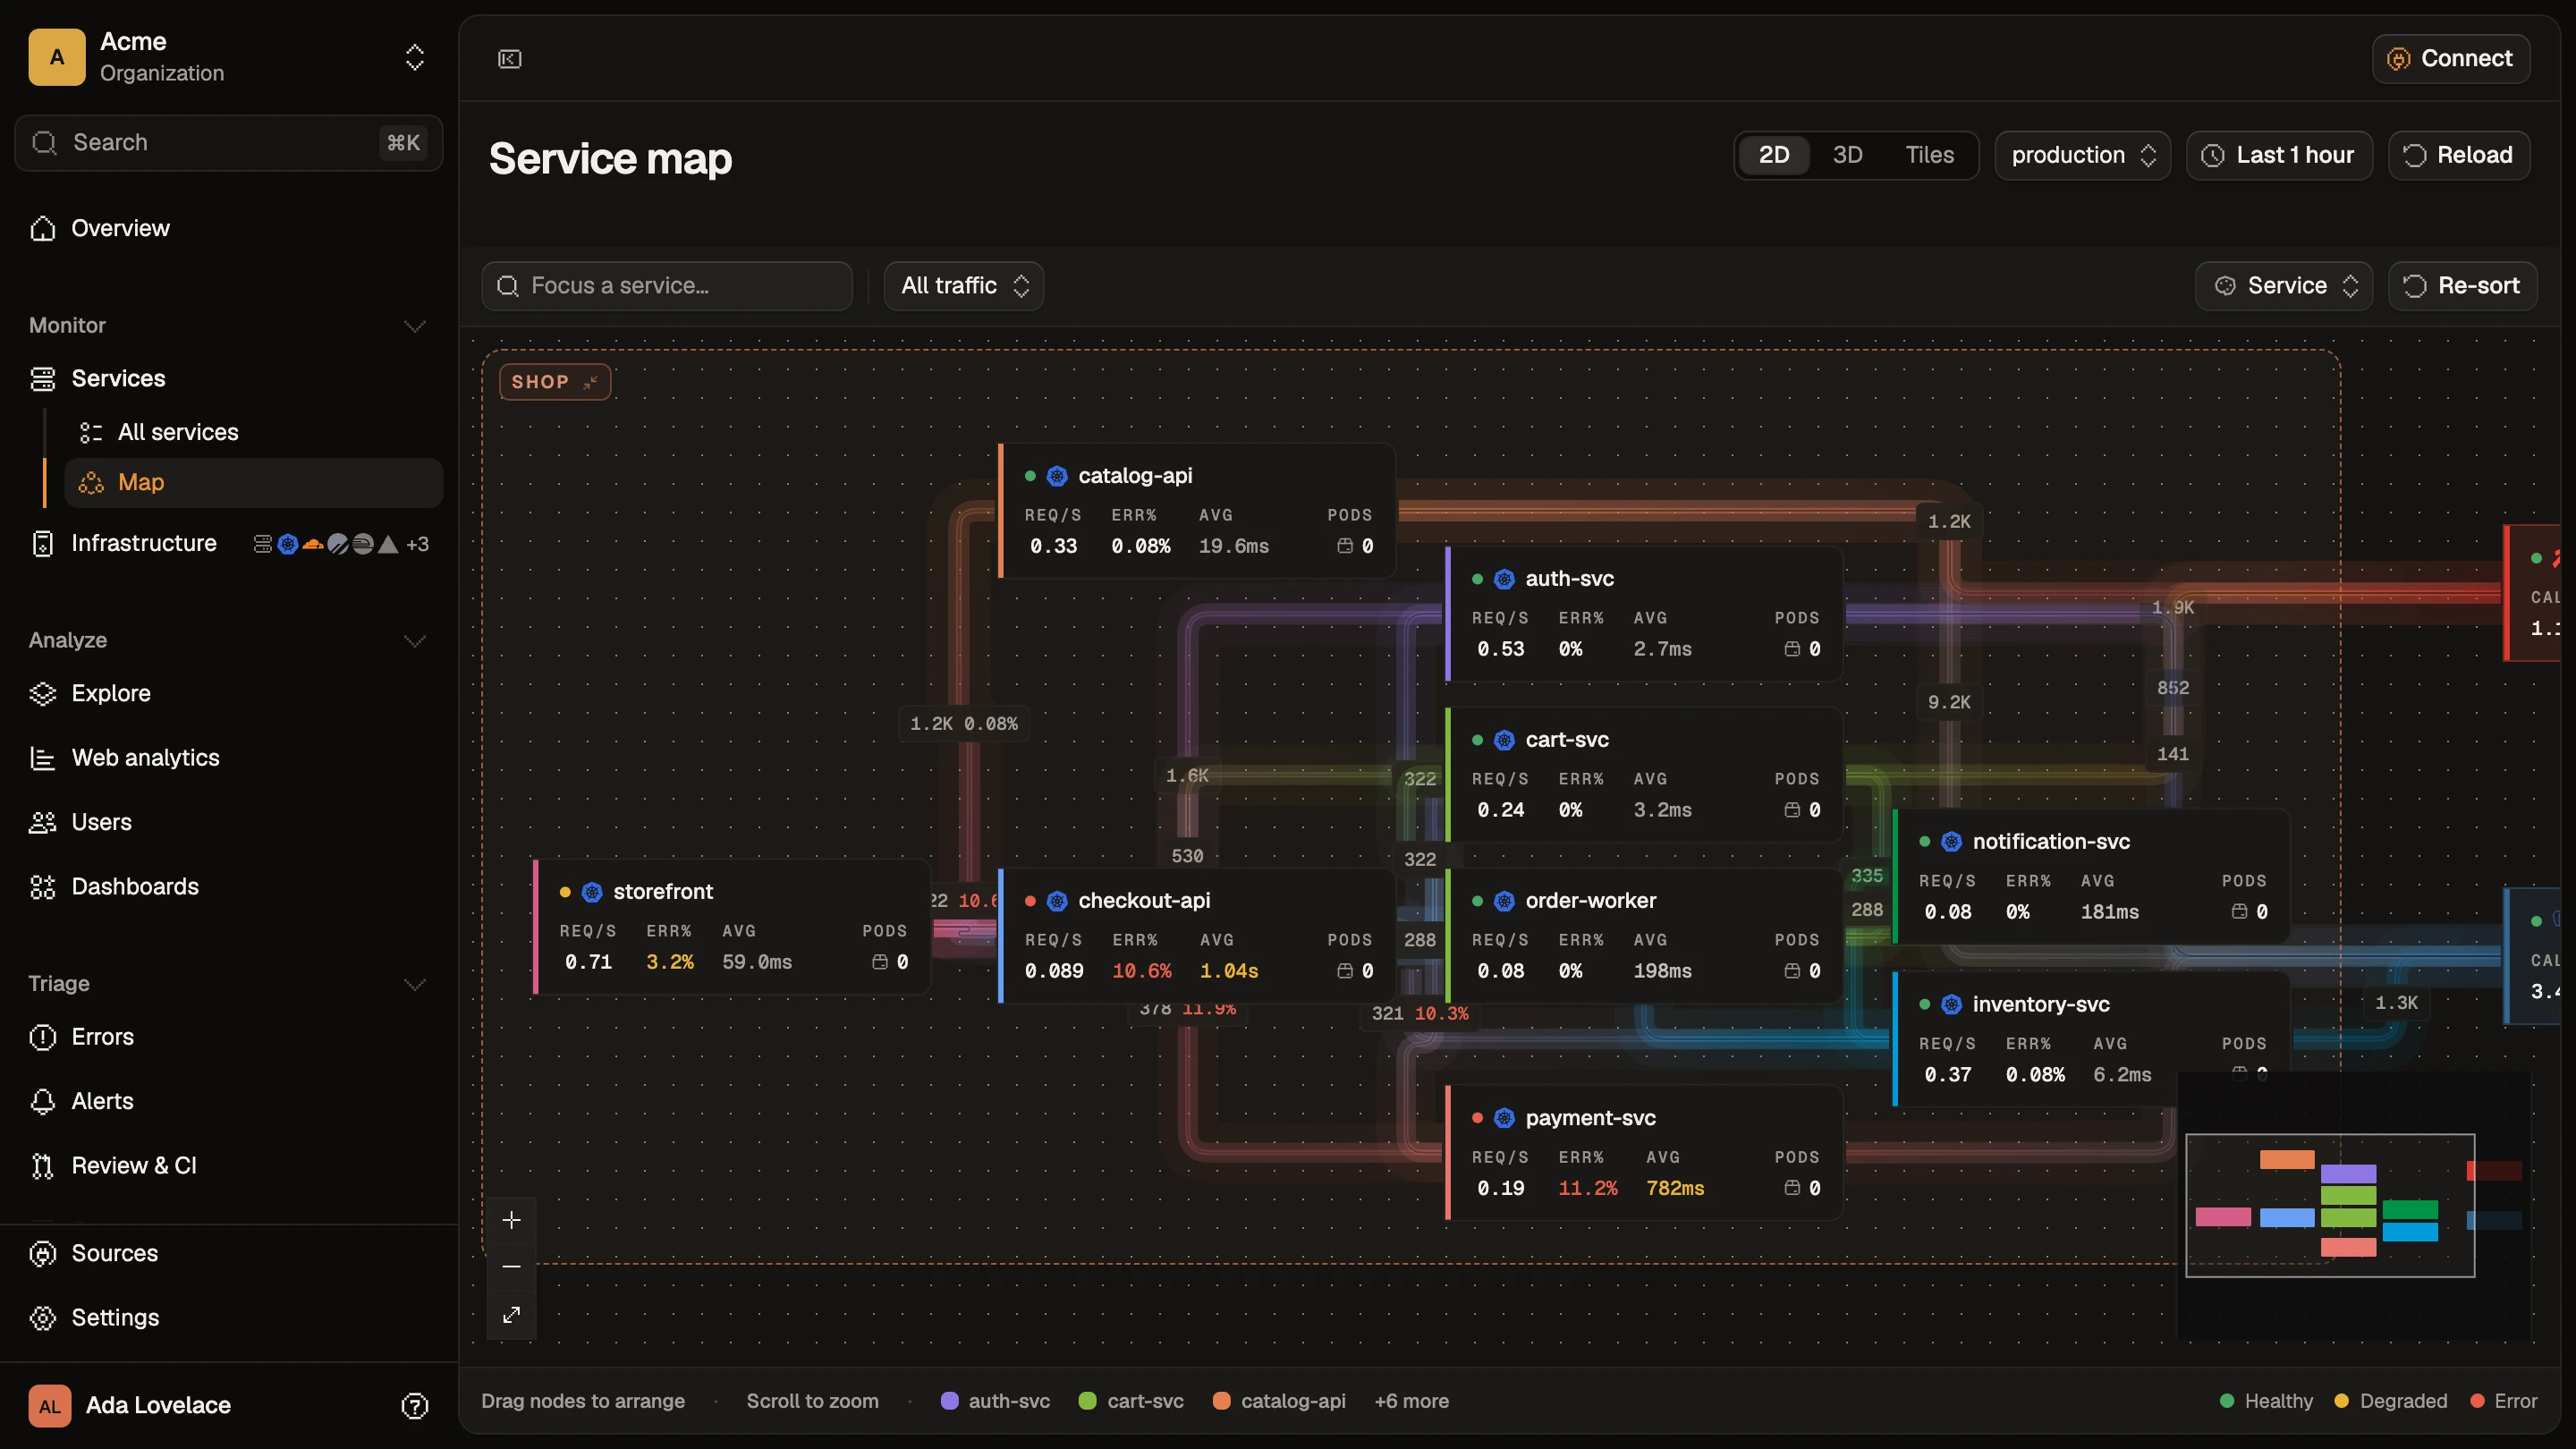
Grafana is the dashboard most engineers already know. Behind it sits a stack: Loki for logs, Tempo for traces, Mimir or Prometheus for metrics, each with its own query language and scaling model. Teams look elsewhere when running four services takes more time than using them, when they want one query across signals, or when Grafana Cloud's per-user and per-series pricing stops fitting. These are the seven tools worth comparing, and when to stay.
Maple, the first entry below: a trace on its waterfall view.
We build Maple and list it first because this is our site: that placement is our bias, not a ranking. The rest start with the self-hostable tools, which keep the most of a Grafana setup, then the hosted platforms. Every price comes from the vendor's own pricing page, linked at the bottom with the month we checked it.
How we compared: we re-read each vendor's pricing page in November 2026. Other facts repeat sourced rows from our side-by-side comparison pages, each with the month it was last checked. OpenObserve and ClickStack have no comparison page, so their facts link to their own pages below. We did not benchmark the tools against each other; treat this as a map of trade-offs, not a test result.
Updated
The short answer
Self-hosting LGTM and tired of running four services
SigNoz or OpenObserve. One platform each in place of four services, both self-hosted with PromQL.
On Grafana Cloud, paying per user and per series
Maple. One store for traces, logs and metrics, PromQL for metrics, Grafana dashboard import, and no per-user or active-series meter.
Log and trace search is most of the work
ClickStack. Full-text search and SQL over logs and traces, under an MIT license.
Debugging high-cardinality traces
Honeycomb. BubbleUp ranks what is different about the slow or failing requests.
Want hosted PromQL with phone and SMS paging
Better Stack. PromQL, uptime checks and on-call in one hosted product.
At a glance
Tool
Pick it if
Pricing
License
PromQL
Grafana Cloud / LGTM (for reference)
The tool you are replacing
Free tier, then $19/mo + $8 per user beyond three, $6.50 per 1k active series, $0.55 per GB of logs and traces
AGPL-3.0 (Grafana, Loki, Tempo, Mimir); Cloud is proprietary
You want hosted PromQL with uptime checks and phone and SMS paging next to it.
Bundles from $30/mo; logs and traces $0.10/GB + $0.05/GB-month stored (EU)
Closed source; SaaS, custom VPC on Enterprise
Yes
Maple
Built by us
Pick it if: You want traces, logs and metrics in one store behind one query surface, with PromQL for metrics and a Grafana dashboard import.
Maple stores traces, logs and metrics in one place and correlates them by trace id, so a log line opens its trace without a second data source. Metrics take PromQL, and Grafana dashboards import: each panel keeps its first query, rows become sections, and an import report lists anything Maple cannot run yet. There is no per-user fee and no active-series meter; metrics are priced per GB like the other signals.
Strengths
+One query builder for every signal, PromQL for metrics, and SQL through the API and MCP server
+Grafana dashboard import, with a report of what did not carry over
+No per-user fee and no active-series meter
+Uptime checks, on-call schedules, SLOs and error issues in the same app
Trade-offs
-No plugin ecosystem and no non-telemetry data sources
-Alert rules are Maple's own; Prometheus rules are rebuilt
-The self-hosted version has no dashboards, PromQL or alerting yet
-Younger, with a smaller community, and no free plan on Maple Cloud
-SOC 2 and ISO 27001 certification still in progress
Pick it if: You self-host LGTM and want one platform to run instead of four, keeping PromQL.
SigNoz keeps traces, logs and metrics together and queries them with its builder, SQL and PromQL. Prometheus rules carry over. Self-hosting is one platform with Docker, Swarm, Helm and Foundry installs, and the Community edition is multi-user with roles and Google OAuth. Its cloud has no user-based pricing.
Strengths
+PromQL in dashboards, and Prometheus rules carry over
+One platform to deploy and upgrade
+No user-based pricing on SigNoz Cloud
Trade-offs
-15 days for logs and traces and one month for metrics by default
-SAML, OIDC and fine-grained RBAC sit under the commercial license
$49/mo including $49 of usage, then $0.30 per GB of logs and traces · MIT core, SSO and RBAC under a commercial license
Pick it if: You want one self-hosted service for logs, metrics and traces, with SQL and PromQL.
OpenObserve puts logs, metrics and traces in one platform, with SQL for logs and traces and PromQL for metrics from any Prometheus-compatible source. It also covers RUM, session replay and error tracking. The open-source edition is AGPL-3.0, like Grafana's stack, and the self-hosted Enterprise edition is free up to 50 GB of ingestion a day.
Strengths
+One service in place of Loki, Tempo and Mimir
+Self-hosted Enterprise edition free up to 50 GB a day
+Unlimited users on Cloud; metrics kept 15 months
Trade-offs
-The cloud trial lasts 14 days; there is no permanent free cloud tier
-Queries on Cloud are billed per GB scanned
Cloud $0.50 per GB ingested (annual), plus $0.01 per GB queried · AGPL-3.0 open-source edition; Enterprise edition free to self-host up to 50 GB a day
Pick it if: Logs and traces are most of your volume, and you want full-text search and SQL over them.
ClickStack is ClickHouse's observability stack: a UI, a preconfigured OpenTelemetry Collector and ClickHouse. Logs, traces, metrics and session replays live in one store, searched with Lucene-style filters such as level:err or queried with SQL. That replaces LogQL and TraceQL with two query styles most engineers already know.
Strengths
+MIT license; the collector, store and UI scale independently
+Full-text search plus SQL over one store
+An all-in-one Docker image to try it on a laptop
Trade-offs
-No PromQL in its documentation, so Prometheus dashboards are rebuilt
-At volume you operate ClickHouse yourself, or move to ClickHouse Cloud
Free to self-host; managed on ClickHouse Cloud · Open source (MIT)
Pick it if: You would rather ask new questions of traces than maintain dashboards.
Honeycomb is a query engine for wide events, built for asking a question you did not plan a dashboard for. BubbleUp ranks what is different about a slow or failing slice of requests. It bills per event with unlimited seats, which removes Grafana Cloud's user meter.
Strengths
+BubbleUp, heatmaps and SLOs with burn-rate alerts
+Unlimited seats and a free plan with 20M events a month
+60 days of retention on every plan
Trade-offs
-No PromQL; Prometheus dashboards and rules are rebuilt
-Closed source; single-tenant hosting only on Enterprise
Free up to 20M events/mo; Pro $3.00 per million events, from $150 · No (Refinery is Apache 2.0)
Pick it if: You want nothing to operate, 800+ integrations and security products, and per-host pricing fits.
Datadog removes the operating work: one Agent per host, more than 800 vendor-maintained integrations, and products for APM, logs, RUM, synthetics, network monitoring and security. It accepts OTLP, with some features only through the Agent. It does not take PromQL, so Prometheus dashboards and rules are rebuilt.
Strengths
+More than 800 vendor-maintained integrations
+Full RUM, mobile RUM and browser tests
+SOC 2, ISO 27001, HIPAA and FedRAMP
Trade-offs
-Per-host pricing plus a meter for each product
-Some features need the Datadog Agent
-Closed source and SaaS only
Per host: infrastructure from $15, APM from $31, plus per-product meters · No (the Agent is open source); SaaS only
Pick it if: You want hosted PromQL with uptime checks and phone and SMS paging next to it.
Better Stack is an incident platform with telemetry attached. It ingests OTLP, queries with a builder, SQL and PromQL, and Prometheus queries carry over. Around the data it runs uptime checks, Playwright checks, on-call schedules and status pages. Readers are free; anyone on call needs a Responder license.
Strengths
+PromQL and SQL, with low log and trace rates
+Uptime, Playwright checks, and on-call with phone and SMS
+Members who only read telemetry are free
Trade-offs
-Closed source, with no self-hosting
-Metrics billed on stored size, from $0.50 per GB-month
-$34/mo per on-call Responder license
Bundles from $30/mo; logs and traces $0.10/GB + $0.05/GB-month stored (EU) · Closed source; SaaS, custom VPC on Enterprise
8 services · 8 edges · 60s windowpricing-svc · p99 +18% vs 1h ago
Before you switch
When to stay on Grafana
Your dashboards query more than telemetry: Postgres, Elasticsearch, CloudWatch and dozens of other data sources sit in one Grafana panel. None of the tools here matches the plugin catalog.
Your alerting is Prometheus rules and recording rules. Grafana keeps them as they are. SigNoz and Better Stack take Prometheus queries; Maple runs PromQL queries and dashboards but has its own alert rules, so those are rebuilt.
The free tier covers you: 10,000 active series, 50 GB of logs, 50 GB of traces and three users, with 14 days of retention.
You must self-host dashboards and alerting under an open-source license, and your team already runs the stack well. Maple's self-hosted version has no dashboards or alerting yet.
FAQ
よくある質問
What is the best Grafana alternative?
It depends on which part of Grafana you want to replace. To stop running Loki, Tempo and Mimir yourself, look at SigNoz or OpenObserve, which self-host as one platform with PromQL. To leave Grafana Cloud's per-user and per-series pricing while keeping PromQL dashboards, Maple. For log and trace search, ClickStack. If your dashboards mostly query business databases, stay on Grafana. We build Maple, so weigh our view accordingly.
Is there an open-source alternative to the Grafana stack?
Grafana, Loki, Tempo and Mimir are already AGPL-3.0, so the usual question is how many services you want to run. SigNoz has an MIT core with SSO and RBAC under a commercial license. OpenObserve's open-source edition is AGPL-3.0. ClickStack is MIT. Maple is source-available under FSL-1.1 and becomes Apache 2.0 two years after each release.
Which Grafana alternatives support PromQL?
SigNoz, OpenObserve and Better Stack take PromQL. Maple runs PromQL queries and dashboards on Maple Cloud, with its own alert rules. Honeycomb and Datadog use their own query builders and languages, and ClickStack's documentation lists Lucene-style search and SQL.
Can I keep my Grafana dashboards?
On Maple, Grafana JSON imports: each panel keeps its first query, rows become sections, and an import report lists anything Maple cannot run yet. Log panels are read on the Logs page instead. Elsewhere, plan to rebuild the dashboards you actually use, and let the unused ones lapse.
When does Grafana Cloud get expensive?
When users and metric series grow. Pro includes three active users, then charges $8 per user. Metrics cost $6.50 per thousand active series, so a label with many values multiplies the bill. Logs and traces cost $0.55 per GB with 30 days of retention. The Maple vs Grafana page prices one month on both at list price.
出典
Where the vendor facts come from
Prices link to each vendor's own pricing page, with the month we last checked it. Every other claim
repeats a row on the matching Maple vs page, where it carries its own source, or comes from a vendor
page listed here. If something is out of date, tell us and we will fix it.